Geoscience Reference
In-Depth Information
over northern Scotland, but a secondary low spread across southern England and accounted for most of the heavy
rainfall and the high wind speeds in that area (
Figure 7.10
).
The heavy rain associated with this storm marked the
start of a period of serious flooding caused by frequent and deep depressions which affected much of lowland England.
50
50
70
60
80
60
80
90
100
90
70
50
60
70
100
80
90
100
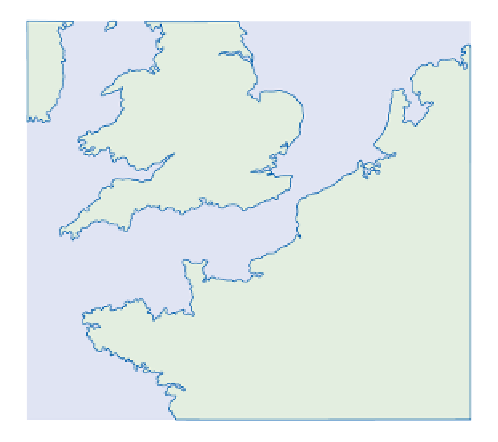
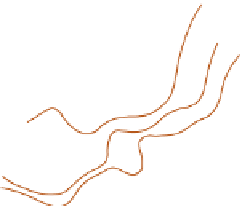
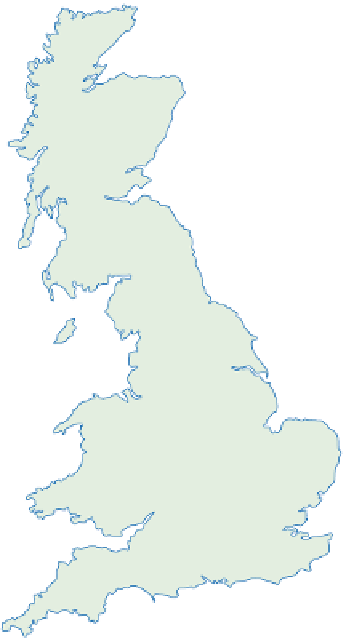
England and the near continent, 16 October 1987.
Source: Based mainly on anemograph data and Weather (1988)
100
100
90
80
70
60
50
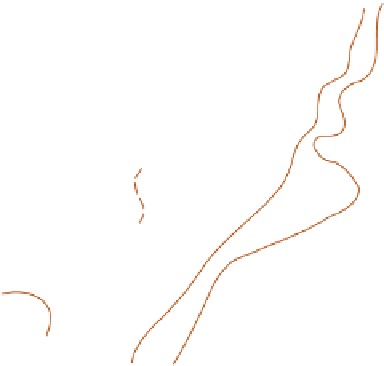
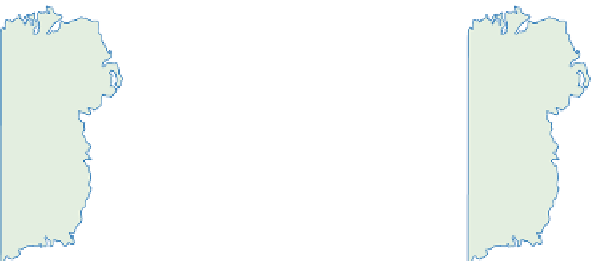
(a)
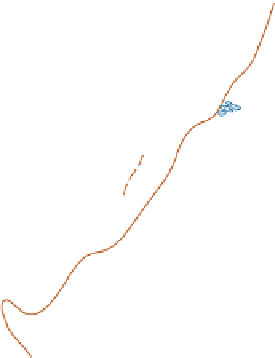
(b)
2
10
20
40
40
50
1
50
40
2
20
30
10
5
20
1
5
10
2
20
15
10
30
20
1
30
5
30
40
20
30
20
70
40
60
30
40
60
50
50
40
40
50
50
60
40
50
30
70
20
0
100
0
100
km
km
Source: Meteorological Office website