Geoscience Reference
In-Depth Information
(a)
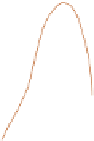
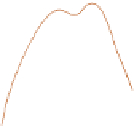
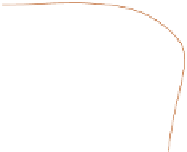
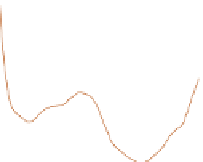
Figure 6.18
Mean zonal wind for
and (b) June-August
(m s
-1
). Positive values
denote a westerly
wind. Negative values
indicate easterly wind.
Source:
www.
ecmwf.int/research/era
100
200
300
400
500
600
m
s
-1
100
80
60
50
40
35
30
25
20
15
10
5
2
-2
-5
-10
-15
-20
-25
-30
-35
-40
-50
-60
-80
-100
700
800
900
1000
10°
20°
30°
40°
50°
60°
70°
80° 90°S
90°N 80°
70°
60°
50°
40°
30°
20°
10°
0°
Latitude
(b)
100
200
300
400
500
600
700
800
900
1000
90°N
80°
10°
20°
30°
40°
50°
60°
70°
80° 90°S
70°
60°
50°
40°
30°
20°
10°
0°
Latitude
150°
30°W
0°
30°E
150°
180°
120°
120°
60°
60°
90°
90°
90°
90°
5
440
60°
60°
120°
120°
30°W
0°
30°E
150°
180°
150°
Source:
www.ecmwf.int/research/era