Geoscience Reference
In-Depth Information
the turbulent fluxes of water vapour, sensible heat and
momentum. Sensitive and precise sensors of temperature,
vertical and horizontal wind speed and humidity are
required, together with a suitable logging system to collect
the vast amounts of data generated. Such instruments are
instrument above coniferous forest is shown in
Plate 21.3
.
some of them so complex that it is almost impossible to
use them under normal circumstances: the necessary data
are not collected except during special programmes.
This problem is illustrated by what at first seems to be
a very simple approach. As we saw in
Chapter 3,
the
energy budget can be expressed as follows:
Q
* =
Q
H
+
Q
E
+
Q
G
Meteorological formulas
Because evapotranspiration is greatly dependent upon
atmospheric conditions, it is possible to derive good
estimates of PE from data on meteorological conditions.
A wide range of formulas have been developed to do this,
where
Q
* is the net radiation,
Q
H
is the sensible heat flow,
Q
E
is the energy use through evaporation and
Q
G
is the
heat flow into the ground. If we could determine all the
other components of the equation we could find
Q
E
by
difference, and that would tell us how much evaporation
was occurring. Unfortunately we rarely know the value of
the other components precisely.
Because of this problem of obtaining data, a large
number of simpler, more empirical formulas have been
devised. They are much easier to use; they are based,
however, not on physical principles but on the observed
relationship between evapotranspiration and one or more
climatological variables. The relationships have usually
been obtained under one particular climatic regime and
they may not be applicable elsewhere, hence the number
of formulas.
Probably the best known of these empirical equations
is that developed by Thornthwaite to determine PE.
Thornthwaite was trying to devise a climatic classification
that went beyond mere description and incorporated
indices of heat and water availability and how they were
related to vegetation. In simple terms, PE is calculated
from the formula:
PE = 1·6 (10
T
/I)
a
where PE is the unadjusted monthly value of potential
evapotranspiration,
T
is the mean monthly temperature
in degrees Celsius, I is an annual heat index derived from
the sum of twelve monthly index values and
a
is a func-
tion that varies in relation to I. There are other minor
adjustments required to allow for day length variations.
Fortunately nomograms and tables have been prepared to
simplify the calculations.
In this formula Thornthwaite is using temperature
as a substitute for radiation, and it therefore works
reasonably well where the two are closely correlated. In the
tropics, however, the equation underestimates PE because
temperatures lag behind radiation inputs. In addition, the
method takes no account of wind, even though it may be
locally important. Nevertheless the relative simplicity of
the method and availability of temperature observations
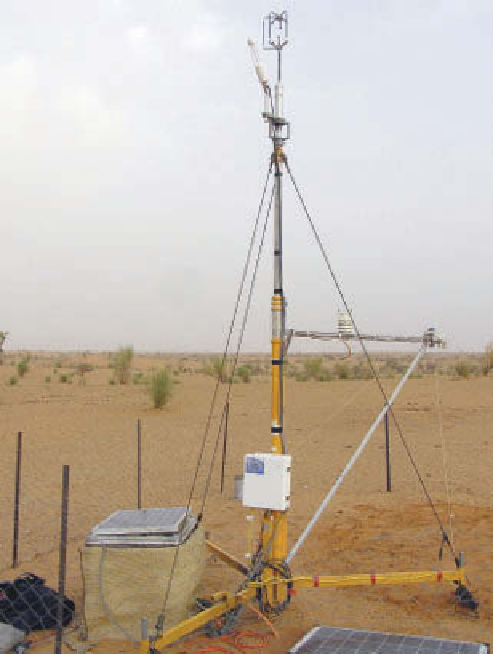
and carbon dioxide fluxes. Photographed in northern Mali
(15°N) at the end of the dry season, the mast is topped by a
sonic anemometer and an infra-red gas analyser (inclined
white sensor near top of mast). In addition standard weather
elements such as temperature, humidity, precipitation, short
and long-wave radiation and soil temperatures are measured.
Power is provided by the solar panels that recharge car
batteries. The data are preserved in a data logger in the large
aluminium box on the left.
Photo: Colin Lloyd, Centre for Ecology and Hydrology