Geoscience Reference
In-Depth Information
mid-latitudes, where rainfall is associated with the activity
of the rain-bearing cyclones, winter and autumn are
relatively wet, for it is at those periods that the westerlies
bring the most frequent and intense storms.
In the tropics and subtropics, where convectional
rainfall is more important, precipitation tends to be more
abundant during the summer months (
Figure 5.8
).
The
magnitude of these seasonal variations is even more
marked in the monsoonal areas of the world, where the
year can be subdivided into a wet season and a dry season.
At Cherrapunji in the Khasi hills of Assam, India, for
example, mean rainfall during August is over 1,600 mm;
from November to February it is almost zero. In 1974
24,550 mm were recorded, the vast majority falling in the
May-September period, and on 16 June 1995 1,563 mm
fell in one day. Much of the precipitation is the result of
the funnelling of moist air from the Bay of Bengal up the
slopes of the Khasi hills by upper-tropospheric easterlies,
not simple convection. In the monsoon areas of Africa and
northern Australia seasonal differences are also great, so
that hydrological conditions vary considerably through-
out the year. During the dry season there is practically no
surface run-off, but in the wet season run-off is extensive.
Vegetation, geomorphological processes and human
activities all respond to these changes.
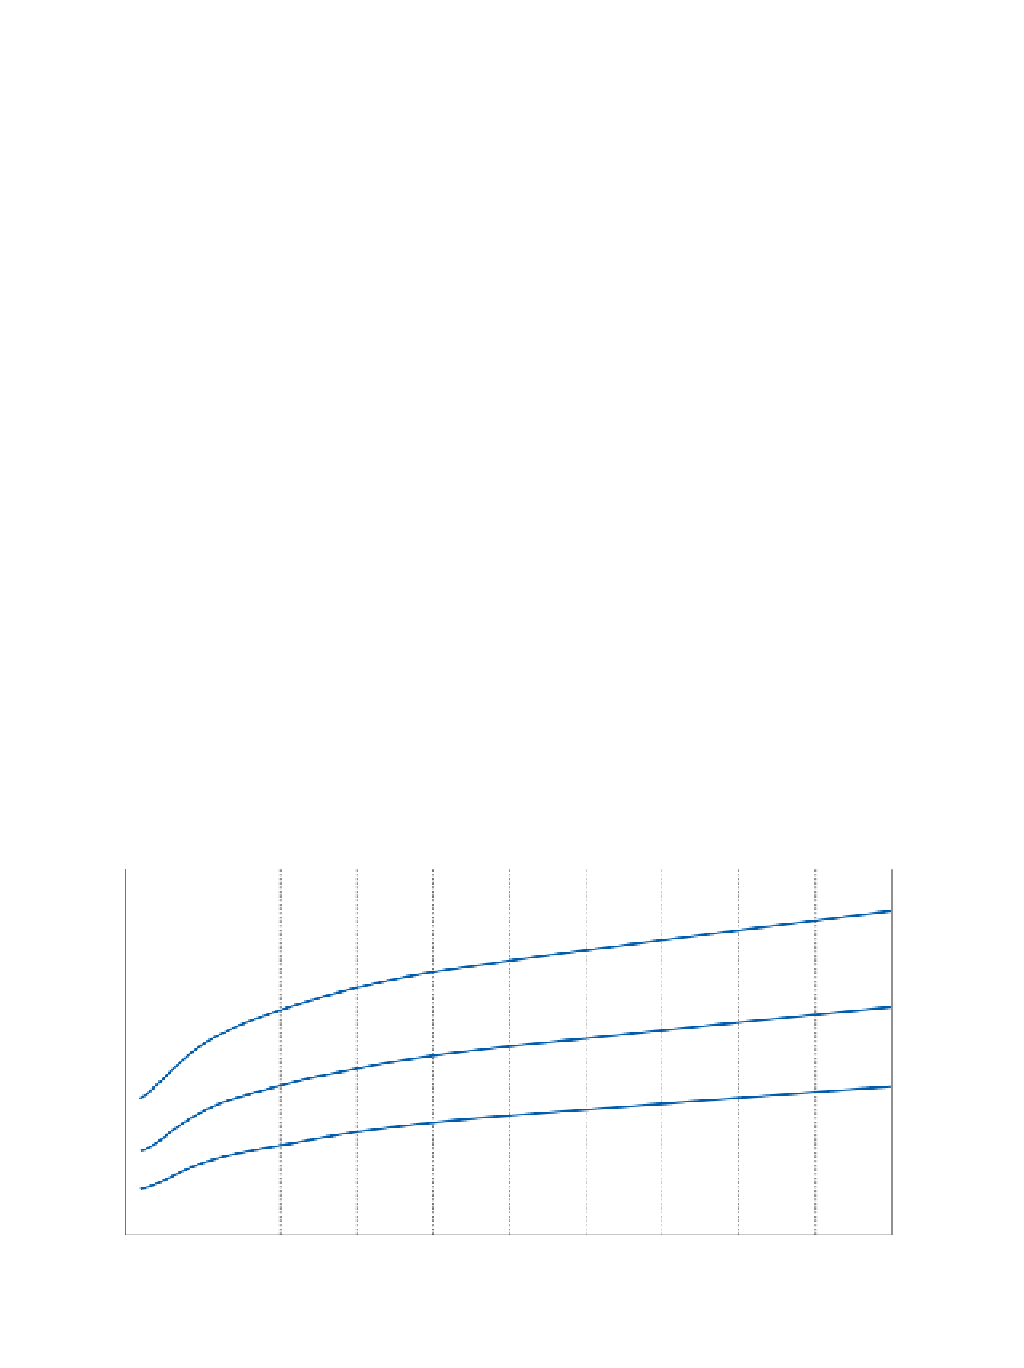
Rainfall frequency
In view of the important consequences of extreme
variations in rainfall, it is useful to have some measure of
the reliability of precipitation. This may be expressed in
a number of different ways. One of the most common is
to plot graphs of what are called rainfall recurrence
intervals. Using data from a long time period, say fifty
years, it is possible to estimate the frequency with which
storms of a particular amount or intensity are exceeded.
In general, small storms occur most commonly and very
heavy storms only rarely. Thus a graph like that in
Figure
5.9
is obtained. From this it is possible to tell how
frequently a storm giving, for example, 50 mm or less in
a day will occur, or how many years it will be on average
between storms of 100 mm or more per day. Such
information can be very useful in planning bridges or
drains, when the aim is normally to produce something
Amarillo (Texas)
(1100m)
100
Mean annual precipitation = 520 mm
75
50
25
0
J
FM A
M
JJASOND
a subtropical summer rainfall zone.
90
80
24 hrs.
70
60
6 hrs.
50
40
1 hr.
30
20
10
0
0
5
10
15
20
25
30
35
40
45
50
Return period (years)
Source: Allitt (2001)