Geoscience Reference
In-Depth Information
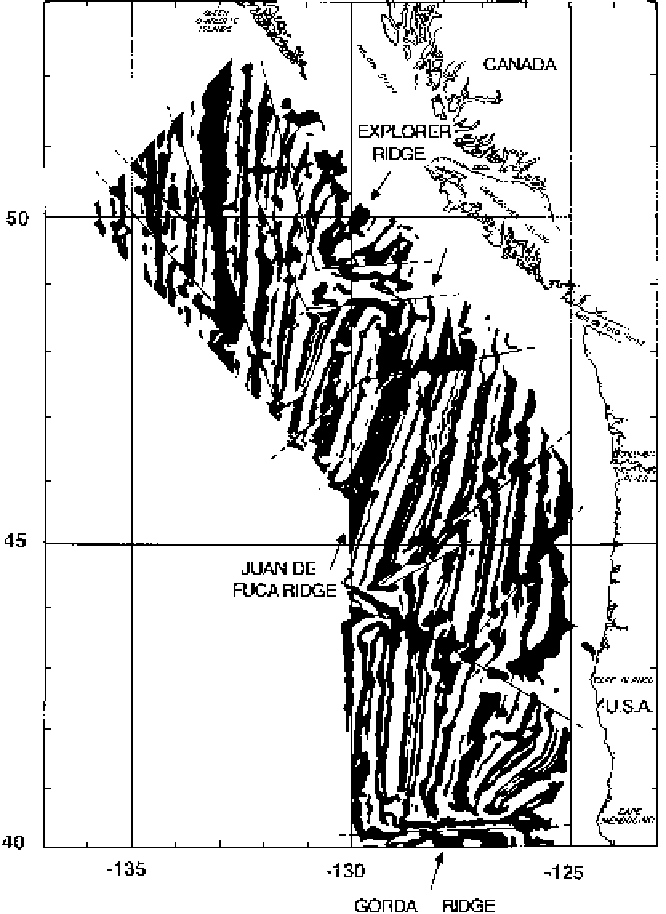
Figure 3.7.
Anomalies of
the total magnetic field
southwest of Vancouver
Island in the northeast
Pacific Ocean. Positive
anomalies are shown in
black and negative
anomalies in white.
Arrows indicate the axes
of the three mid-ocean
ridges; straight lines
indicate the main faults
which offset the anomaly
pattern. This was the first
large-scale map to show
the details of the
magnetic anomalies over
an active mid-ocean ridge.
As such it was a vital
piece of evidence in the
development of the
theories of seafloor
spreading and then plate
tectonics. Compare this
with a more recent
magnetic-anomaly map
for the same area shown
in Fig. 3.22. (After Raff
and Mason (1961).)
direction, of the total field
B
. (Magnetometers that can measure both magnitude
and direction are widely used on land as prospecting tools.) Marine magnetic
anomalies are therefore anomalies in the magnitude (or total intensity) of the
magnetic field.
The first detailed map of magnetic anomalies off the west coast of North
America, published in 1961, showed what was then a surprising feature: alternate
stripes of anomalously high and low values of the magnetic field stretching over
the entire region (Fig. 3.7). All subsequent magnetic-anomaly maps show that
these stripes are typical of oceanic regions. The stripes run parallel to and are