Geoscience Reference
In-Depth Information
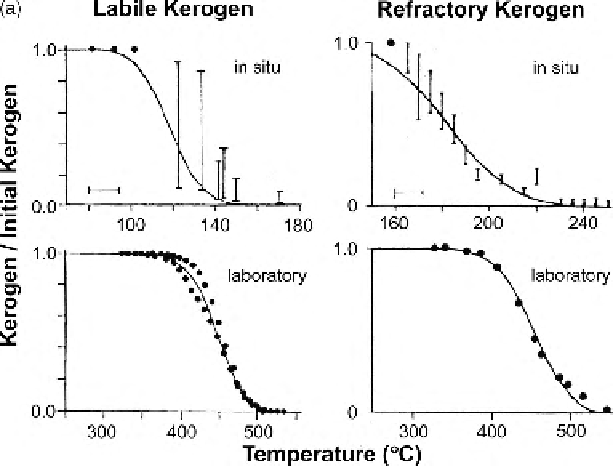
Figure 10.50.
(a) Relative
concentrations of kerogen
for labile kerogen (left)
and refractory kerogen
(right) as a function of
maximum temperature
attained: measured (dots
and bars) and calculated
(solid line). Upper graphs
are geological
measurements and
represent the actual
thermal history of the
samples; estimates of
average heating of these
in situ
kerogens are
1
◦
CMa
−1
for the labile
kerogen and 6
◦
CMa
−1
for
the refractory kerogen.
Lower graphs are for
laboratory-heating
measurements carried out
at 25
◦
C min
−1
. The fit
between measured and
calculated relative
concentrations is good.
(From Quigley and
McKenzie (1988).)
reasonable time, very much higher temperatures have to be attained in the labo-
ratory than are necessary in the Earth. (As an illustration, contemplate cooking
a turkey in an oven at 50, 100, 150, 200 or 250
◦
C.) The range of temperatures
corresponding to the range of plausible geological heating rates is fairly small.
Figure 10.50(b) shows an estimate of the effect of temperature on the time taken
for oil to be transformed into gas. The oil half-life is the time necessary for half
the oil to transform into gas. At a temperature of 160
◦
C, the predicted half-life is
less than 10 Ma, whereas at 200
◦
C the half-life is less than 0.1 Ma. These times
are short on the geological scale.
In summary, mathematical predictions based on geological and laboratory
data indicate that temperatures of 100-150
◦
C are necessary for labile kerogens
to transform into oil, temperatures of 150-190
◦
C are necessary for the cracking of
oil to gas, and temperatures of 150-220
◦
C are necessary for refractory kerogens
to transform into gas.
A standard empirical relationship between temperature and time and the hydro-
carbon maturity is called the
time-temperature index
(TTI). This relationship
states that the reaction rate doubles for each rise of 10
◦
Cintemperature. The
total maturity of a hydrocarbon, or its TTI, is defined as
n
max
n
min
t
j
2
j
TTI
=
(10.27)
j
=
where
t
j
is the time in millions of years that it takes for the temperature of the
material to increase from 100
1)
◦
C, and
n
min
and
n
max
are
the values of
j
for the lowest and highest temperatures to which the organic
material was exposed. This empirical approach is generally appropriate for
chemical
+
10
j
to 100
+
10 (
j
+
reactions
on
laboratory
timescales
but
has
been
extended
to

