Geoscience Reference
In-Depth Information
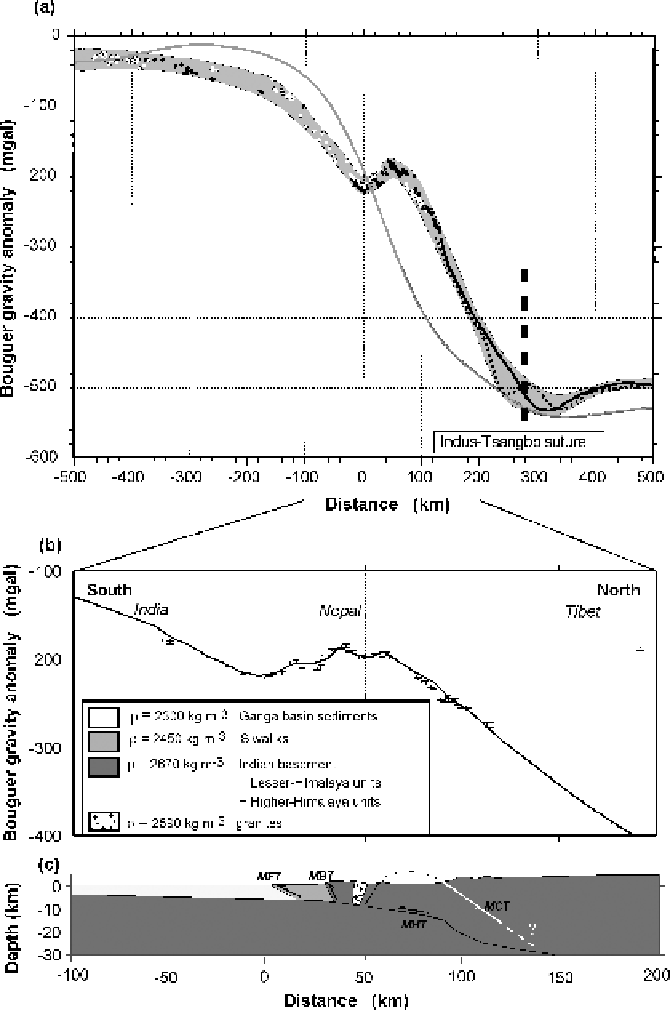
Figure 10.19.
Profiles
perpendicular to the
Himalayas at ∼84-86
◦
E.
Distances are in
kilometres from the main
frontal thrust fault (MFT).
(a) The Bouguer gravity
anomaly. Circles, data;
grey shading shows the
two-dimensional variation
of data (black and white
circles and solid and
dashed black lines are
from two profiles
70 km
apart); the grey line is the
expected anomaly
assuming local isostatic
equilibrium. (b) Details of
Bouguer gravity
anomalies (with error
bars) in the region of the
MFT and MCT. Solid line,
anomalies calculated
from the density model.
(c) The density model.
(From Cattin
et al
.(2001).)
∼
observed, being too small over the sedimentary Ganga (Ganges) foreland basin
to the south of the mountains and too large over the mountains and beneath Tibet.
This means that the Ganga Basin is over-compensated (there is a mass deficiency
relative to the isostatic model) and that the Himalayas are under-compensated
(there is a mass excess relative to the isostatic model) by as much as 100 mgal. A