Geoscience Reference
In-Depth Information
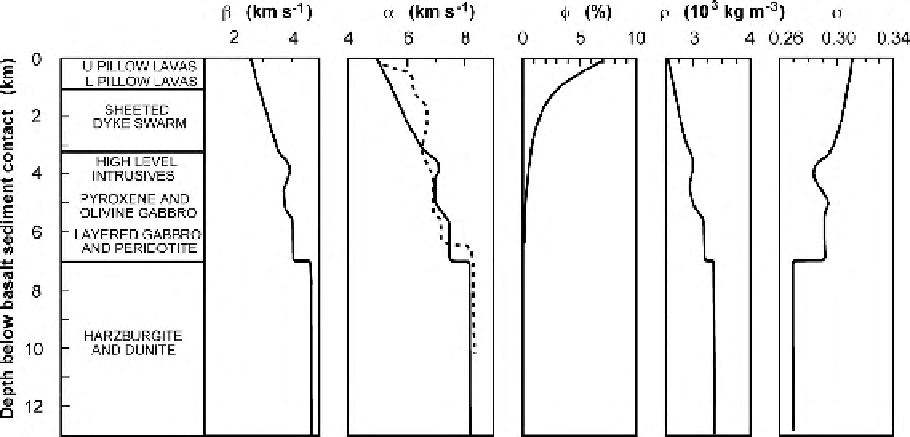
Figure 9.9.
Shear-wave velocity
β
, compressional-wave velocity
α
, effective porosity
φ
, density
ρ
and Poisson's ratio
σ
, versus depth and rock type as measured in the
laboratory, on samples taken from the Semail ophiolite in Oman. The dashed line
shows the compressional-wave velocity measured on samples from the Blow Me
Down Massif, an ophiolite in Newfoundland, Canada. (After Christensen and
Smewing (1981).)
9.2.2 Oceanic upper mantle
The seismic P-wave velocity of the uppermost oceanic mantle averages
8.1 km s
−
1
. The oceanic crust-mantle boundary may be a sharp transition but
can have a finite, variable thickness and is often a thin gradient zone. It marks
the transition from the basaltic-gabbroic crust to the peridotitic mantle. As with
all seismic and geological boundaries, there is some uncertainty about the exact
correlation between the seismic boundary and the petrological boundary - hence
expressions such as the 'seismic Moho' and the 'petrological Moho', which need
not be exactly coincident. Correctly speaking, the Moho is a seismic boundary,
and presumably it is the transition downwards into ultramafic rock. Petrologists,
however, distinguish between zones of cumulate ultramafic rock (such as dunite,
which is made of olivine; see Fig. 8.10), which have precipitated from a melt, and
the underlying deformed residual upper mantle known as tectonite ultramafic. To
a petrologist, this boundary is the significant dividing line because it separates the
top of the residual mantle from the overlying material which is ultimately derived
from the partial melt at the ridge axis. This boundary is termed the petrological
Moho.
There is a gradual increase of seismic P-wave velocity with depth in the
oceanic upper mantle, amounting to about 0.01 km s
−
1
per kilometre of depth. In
addition, there is evidence of anisotropy: the P-wave velocity of the upper mantle