Geoscience Reference
In-Depth Information
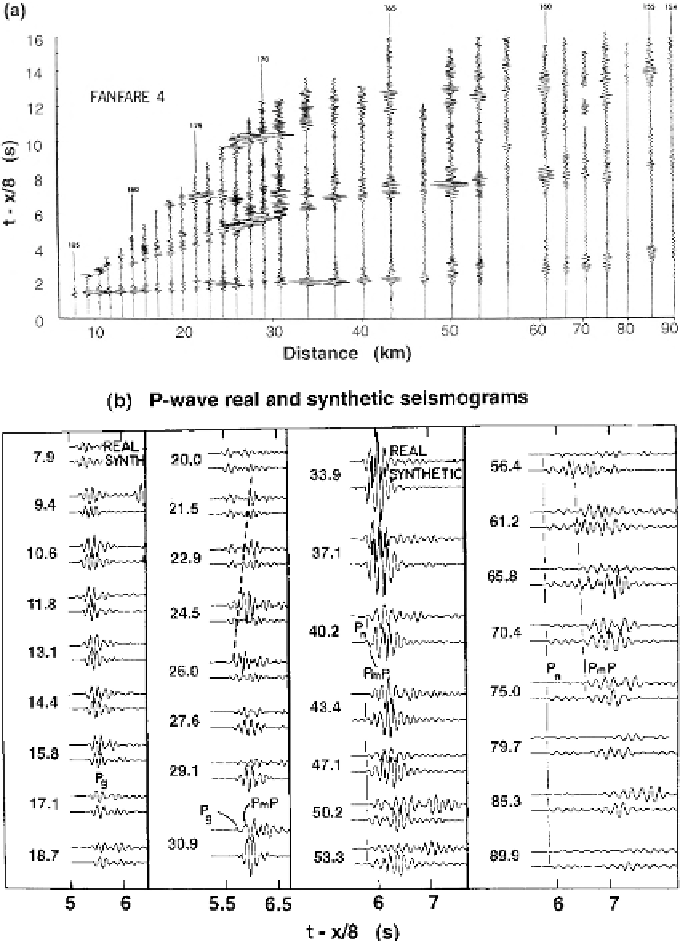
Figure 9.6.
Real and
synthetic seismograms
for a refraction line shot
between Guadalupe
Island and Baja California
on 15-Ma-old oceanic
crust. (a) Real data: a
reduced record section.
(b) P-wave seismogram
pairs. Synthetic
seismograms computed
from the model in (d). (c)
Real and synthetic S-wave
seismograms. Best-fitting
synthetic seismograms
were computed from the
S-wave model in (d);
synthetic seismograms
marked
σ
= 0.28 (the
third in each set) were
computed from the
P-wave velocity model in
(d) with Poisson's
ratio
σ
= 0.28.
(d) P-wave and S-wave
velocity models. All
velocity-depth models
satisfying the travel-time
data lie within the
extremal bounds as
determined from the
travel-time inversion.
(From Spudich and Orcutt
(1980).)
the shear reflection from the mantle (S
m
S): The critical distance for S
m
Sistoo
large, and the arrival time is too early. The critical distance could be decreased
by elevating the S-wave Moho, but this would cause S
m
Stoarrive earlier still. A
solution can be obtained, however, by introducing a low-velocity S-wave zone into
the lower crust; this reduces the S
m
S critical distance and delays the arrival times
without affecting the P-wave structure at all (see Fig. 9.6). It is suggested that
these well-defined low S-wave velocities could indicate the relative abundance