Geoscience Reference
In-Depth Information
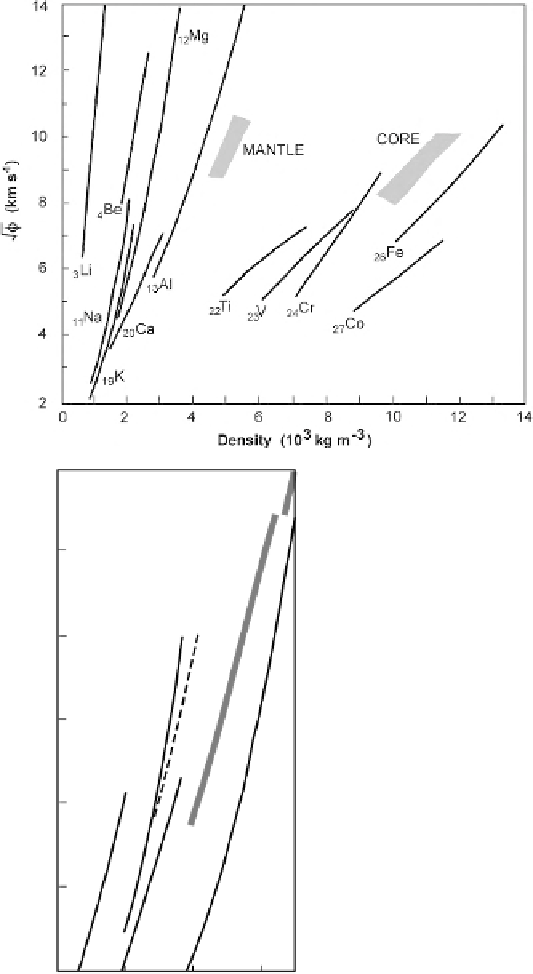
Figure 8.12.
(a) The
seismic param
eter
φ
,
√
φ
=
√
K/p
=
(a)
4
3
β
2
2
α
−
from Eq. (8.20) plotted
against density for metals.
These values were
obtained from
shock-wave experiments.
The shaded regions show
the ranges of values for
the mantle and core given
by the seismic models.
(After Birch (1968).) (b)
Pressure and density as
measured in shock-wave
experiments for iron and
the iron compounds
which may be present in
the core. The heavy line
shows values for the core
calculated from a
seismic-velocity model.
(Based on Jeanloz and
Ahrens (1980) and Jeanloz
(1983).)
(b)
300
200
FeO
FeS
Fe
100
FeSi
Ni--Fe
6
8
10
12
3
--3
Density (10 kg m )
iron in the inner core is in the f.c.c. phase then there seems no need for any light
impurity. The h.c.p. phase has a higher density than the inner core so, if iron is
in this phase, there must also be an impurity. Clearly whether or not any light
impurity is present in the inner core cannot be established until the phase diagram
for pure iron at core temperatures and pressures has been well determined (see
also Section 8.3.1). Calculations show that, when sulphur or silicon impurities