Geoscience Reference
In-Depth Information
(d)
(a)
Effective elastic thickness
0
20
400
°
C
40
other
superswell
800
°
C
60
0 50 100
Age of plate at loading (Ma)
(b)
Oceanic intraplate earthquake depths
0
20
400
C
°
40
GDH1
800
°
C
60
PSM
0 50 100
Age of lithosphere (Ma)
(c)
S-wave velocity
0
0 4 4 20 20 52 52 110 >110
--
--
--
--
km s
−
1
20
3.9 4.5 4.7
40
800
°
C
60
1000
°
C
80
0 50 100
Age of lithosphere (Ma)
Figure 5.17.
The thermal structure of the oceanic lithosphere is consistent with
other geophysical data. Isotherms for two different plate models (Section 7.5.2) are
shown: PSM (dashed line) and GDH1 (solid line). (a) The effective elastic thickness of
the oceanic lithosphere, estimated from the way the lithosphere supports loads,
increases approximately as the 400-
◦
C isotherm. Open circles, normal oceanic
lithosphere; filled circles, oceanic lithosphere in the vicinity of superswells. (b) The
maximum depth of intraplate (within-plate) seismicity also increases with age. (c)
The shear-wave velocity structure of the oceanic lithosphere as determined from
surface wave dispersion in five age ranges. The vertical line corresponds to
4.5 km s
−1
. The depth to the low-velocity zone increases with lithospheric age. (After
Stein and Stein, Thermomechanical evolution of oceanic lithosphere: implications
for the subduction process and deep earthquakes (overview), Geophysical
Monograph 96, 1-17, 1996. Copyright 1996 American Geophysical Union.
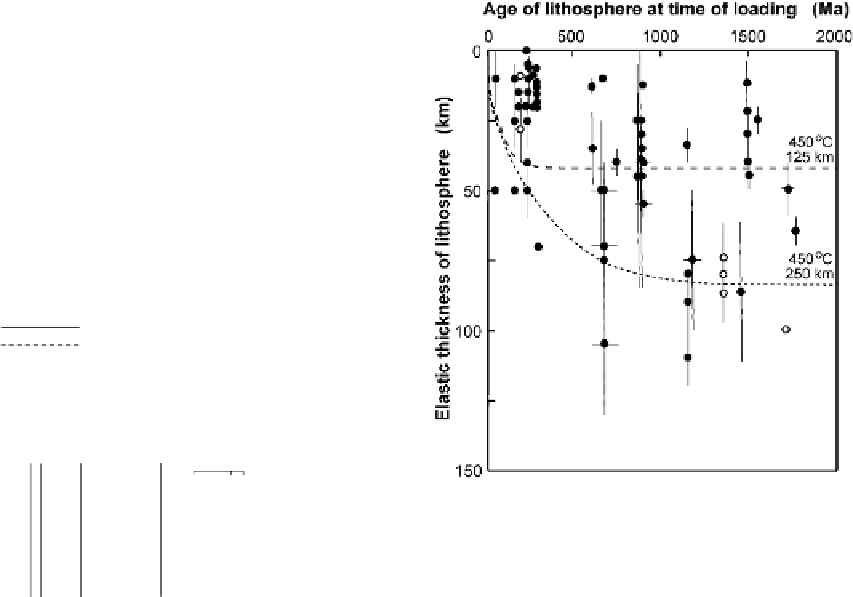
Reproduced by permission of American Geophysical Union.) (d) The elastic thickness
of the continental lithosphere plotted against the age of the lithosphere at the time
of loading. Dashed lines show 450-
◦
C isotherms for lithosphere thickness 125 and
250 km. Open circles, glacial loading, black circles, foreland basins. (Redrawn from
Watts,
Isostasy and Flexure of the Lithosphere
, 2001, Cambridge University Press.)