Geoscience Reference
In-Depth Information
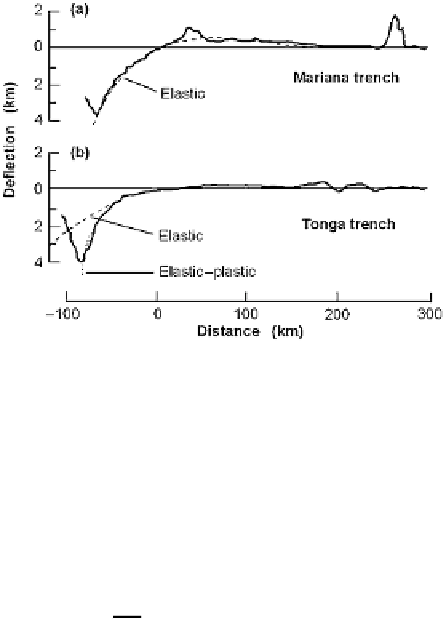
Figure 5.16.
Observed (solid line) and theoretical (dashed line) bathymetric profiles
across two subduction zones. (a) The bathymetry of the Mariana Trench is fitted by
the flexure of a 28-km-thick elastic plate. (b) The bathymetry of the Tonga Trench is
not fitted well by flexure of an elastic plate but is fitted by flexure of an elastic and
then perfectly plastic plate 32 km thick with a yield stress of 1000 MPa. (After Turcotte
et al
.(1978).)
deflection of the plate is then given by
exp
−
M
sin
x
α
+
(
V
α
+
M
) cos
x
α
2
2
D
α
x
α
w
(
x
)
=
−
,
x
≥
0
(5.64)
This topographic profile has, like the island-chain profile, a pronounced forebulge,
as is observed for subduction zones. The parameters
M
and
V
cannot be reliably
estimated in practice, but fortunately the width and height of the forebulge can
be, and these can be used to calculate
and hence the elastic thickness of the
lithosphere. Figure 5.16(a) shows a topographic profile across the Mariana Trench
and a theoretical profile for
α
70 km. The two profiles are clearly in good
agreement. Using Eqs. (5.63) and (5.57) and the same values as in the previous
example, the elastic thickness of the subducting oceanic plate is then 28 km.
Although the topography of many trenches can be explained simply as the
bending of an elastic plate, there are exceptions. The Tonga Trench, for exam-
ple, bends more steeply than can be explained by an elastic model of the plate.
However, if the plate is assumed to behave elastically up to some critical yield
stress (e.g., 1000 MPa) and then to behave perfectly plastically
4
above that stress,
the observed deformation of the Tonga Trench can be explained. Figure 5.16(b)
shows observed and theoretical topographic profiles across the Tonga Trench,
α
=
4
If a material deforms plastically (or anelastically), the deformation is irreversible, unlike elastic
deformation, which is reversible.