Geoscience Reference
In-Depth Information
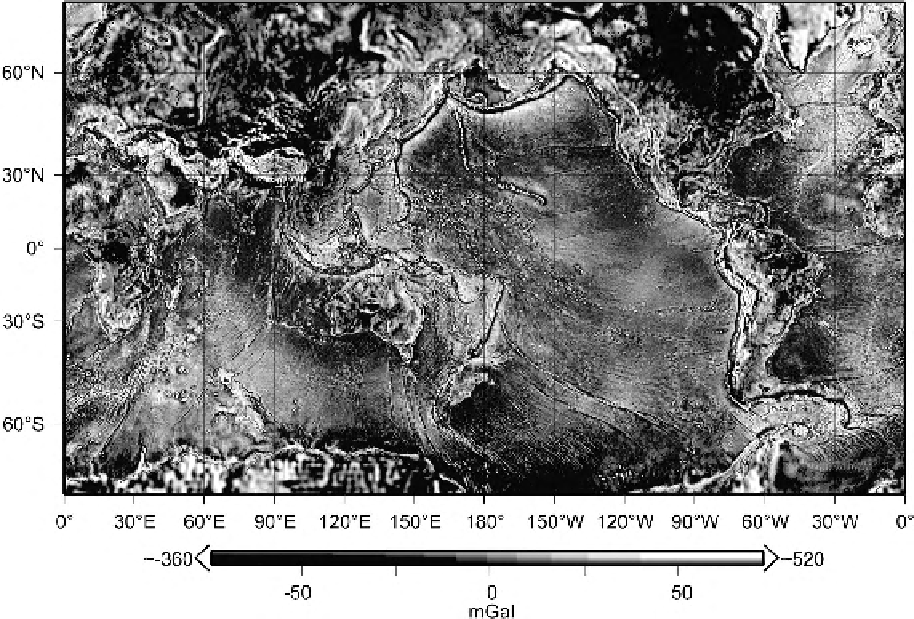
(a)
Figure 5.4.
(a) A colour-shaded relief image of Earth's gravity anomaly field.
(Continents, EGM96; oceans, Smith and Sandwell 1997). Colour version Plate 7. (b)
Global topography from 2-min latitude/longitude grid ETOP02 (Smith and Sandwell
1997). Colour version Plate 8.
international gravity formula (Eq. (5.19)) gives the value of
g
on this spheroid.
Figure 5.3(a) shows the deviation of the geoid from the reference spheroid. The
largest feature is the 'hole' south of India. A ship sailing across that hole would
drop by almost 100 m and then rise again by the same amount, all without doing
work against gravity! Figure 5.3(b) shows the 'average' shape of the Earth (it is
roughly pear-shaped) compared with the reference spheroid.
The fine details of the shape of the Earth and its gravity field have been deter-
mined from artificial satellites (Fig. 5.4). The results have come from studies of
small changes in their orbital parameters and from direct radar-altimetry measure-
ments, in which a radar pulse from the satellite is reflected at the ocean surface and
its time of arrival back at the satellite measured. Satellites have enabled significant
advances in radar altimetry to measure the geoid. GEOS3 and SEASAT, launched
in 1975 and 1978, respectively, were so successful that other altimetric satellites