Geoscience Reference
In-Depth Information
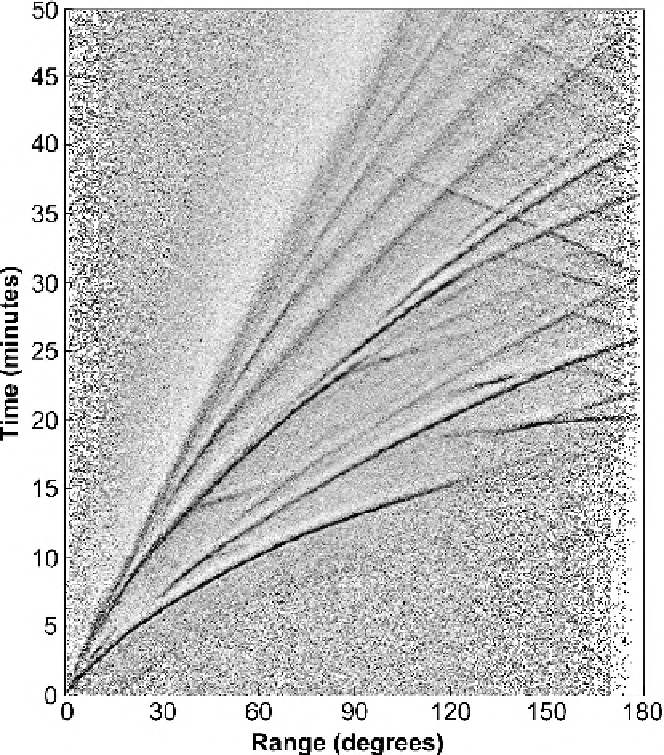
(a)
Figure 4.18.
(a) Vertical-component long-period (∼20 s) seismogram travel-time
curves. This plot has been generated using over 60,000 global records from 2995
earthquakes, which were recorded digitally between 1980 and 1987. The plot is
dominated by P and S energy: P, PKP, PP, PPP, S, SKS, SKKS, etc. Faint reflections
from the upper-lower-mantle discontinuity can also be seen. However, PcP and PcS
reflections from the core-mantle boundary are not well imaged - shorter-period data
are needed. (From Earle, P. S. and Shearer, P. M. Characterization of global
seismograms using an automated-picking algorithm,
Bull. Seism. Soc. Am.
,
84
,
366-76, 1994
c
Seismological Society of America.) (b) A stacked-record section of
the Earth's seismic response at periods
60 s. The data were recorded between
1981 and 1991 by the IDA network, a global array of digital vertical-component
instruments. Positive arrivals are black, negative arrivals white. The Rayleigh waves
are imaged very well - note the clear dispersion (Section 4.3.1). (From Shearer, P. M.
Imaging Earth's response at long periods,
EOS Trans. Am. Geophys. Un.
,
75
, 449,
1994. Copyright 1994 American Geophysical Union. Reproduced by permission of
American Geophysical Union.)
>