Geoscience Reference
In-Depth Information
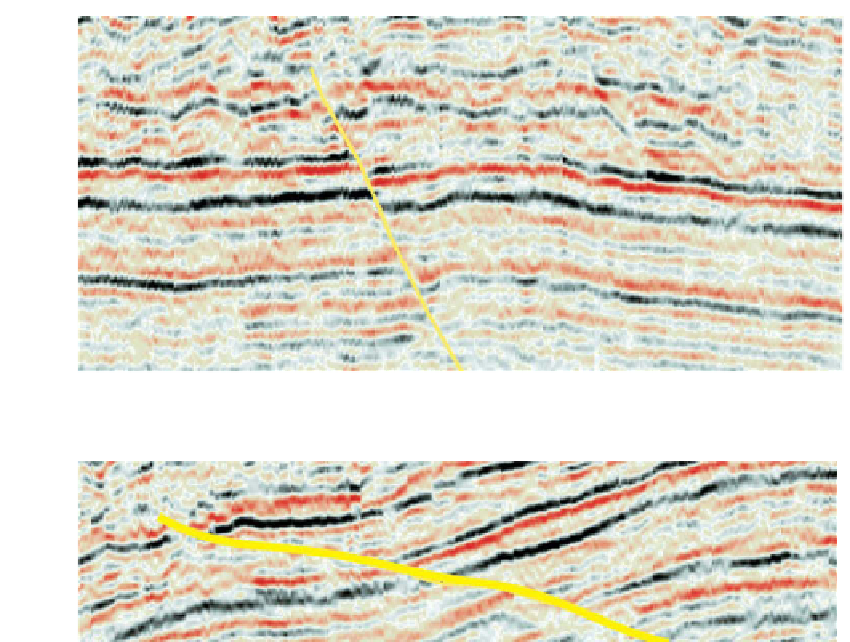
Fig. 3.12
Dip section through fault.
Fig. 3.13
have two display screens, so that one can be used for seismic sections and the other for
maps.
One of the great benefits of 3-D seismic is that it is easier to establish fault pat-
terns than with a grid of 2-D seismic. Semi-automated techniques will be discussed in
section 3.2.4
,
but even with manual picks the density of the trace data avoids aliasing
some parallel lines. If the faults all have similar general magnitude and appearance on
the sections, it will not be obvious whether to join up the intersections as shown by the
solid lines or as shown by the dashed lines. If these were data from a 3-D survey, the
ability to view the crosslines would make it immediately clear which pattern is correct,
although the problem is also much less likely to arise with 3-D data in the first place
because the picked inlines are spaced much more closely than for a 2-D survey. It is
usually fairly easy to correlate the faults in the map view of a horizon picked on a 3-D
survey, and to draw polygons for the horizon cutout caused by the fault if it is normal
(fig. 3.15)
. Reverse faults give rise to multi-valued horizons; if necessary the up- and
downthrown sides can be mapped as separate surfaces, though in practice it is often
sufficient to treat the faults as being vertical.