Geoscience Reference
In-Depth Information
architecture from which depositional environments can be inferred) better than scales
with violent colour contrasts, which tend to emphasise the continuity of events of
a particular amplitude. Display scales are also under user control; it is possible to
display e.g. only every other trace, or alternatively to interpolate extra traces so that
real traces are separated by several interpolated ones, and similarly in the vertical axis.
The interpreter needs to know the vertical exaggeration implied by his choice of scale
factors; commonly, he wishes to see as much as possible of the lateral development
of a geological feature at a vertical resolution adequate to pick a reflector accurately,
and the result is often a display with a vertical exaggeration factor of e.g. 2-4. There
is no harm in this so long as the interpreter is aware of it, but care is needed in picking
faults on sections with high vertical exaggeration, where ramps can easily appear to be
discontinuities.
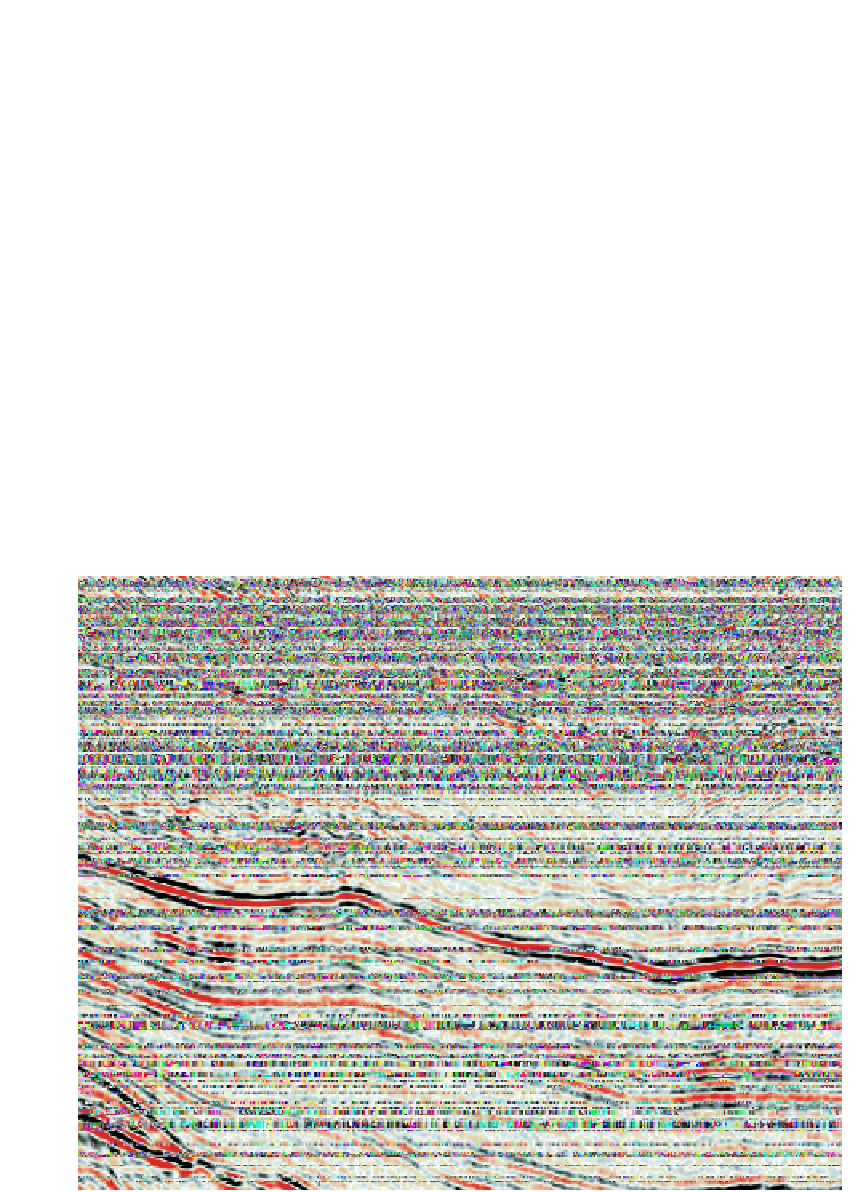
Figures 3.8
and
3.9
s
how the same seismic section in variable intensity and wiggle
trace forms respectively, and illustrate some of these points. The principal reflectors are
easily interpretable on either display. The discontinuous events at the top of the section
comes close to aliasing these small reflector segments.
Fig. 3.8
Seismic section, variable intensity display, red/white/black colour scale.

