Geoscience Reference
In-Depth Information
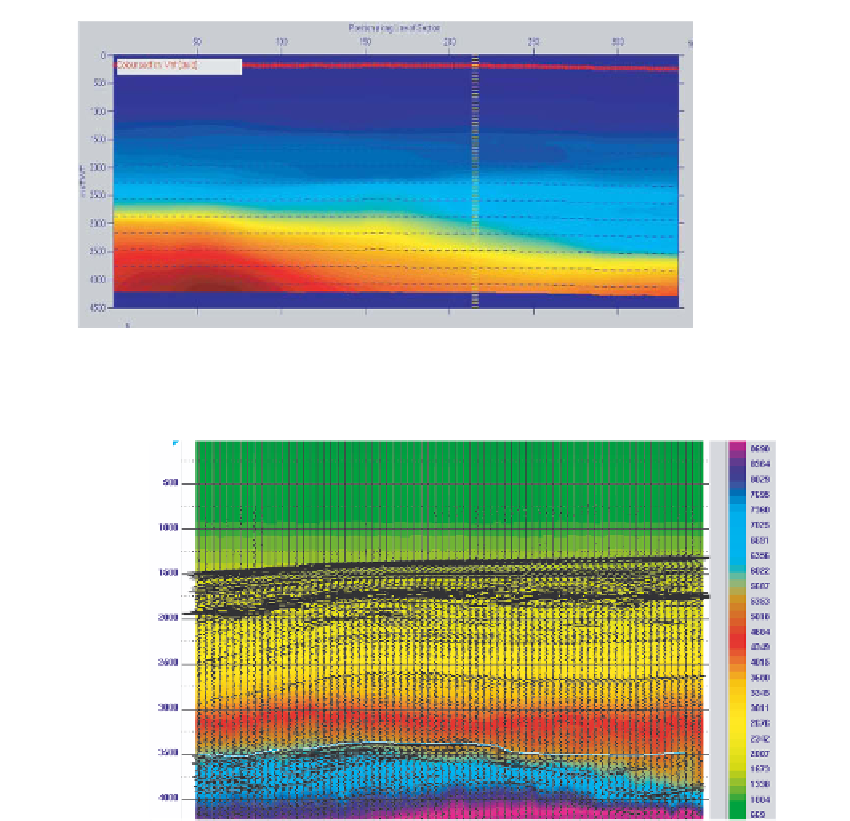
Interval
velocity
(m/s)
Fig. A3.7
Seismic interval velocities.
TWT (ms)
Pore
pressure
psi
Fig. A3.8
Predicted pore pressure (colour) and reflectivity traces.
not be clear how to allow for this in the absence of an understanding of the geological causes of lateral
changes in anisotropy, so results will have additional uncertainty.
After this step the velocities are ready to be used as input to Eaton's equation to calculate a pore
pressure volume. A great improvement in the accuracy of the results can be achieved by calibrating
seismic velocities are in effect being used as a tool to interpolate between or extrapolate away from
wells, and the impact of the uncertainties in the normal compaction trend and the seismic velocities
is much reduced.
can of course be used for prediction of pressures likely to be encountered by a well drilled at any point
within the 3-D volume. The 3-D distribution of pore pressure may also lead to improved understanding
of the mechanisms that cause high pressures.