Geoscience Reference
In-Depth Information
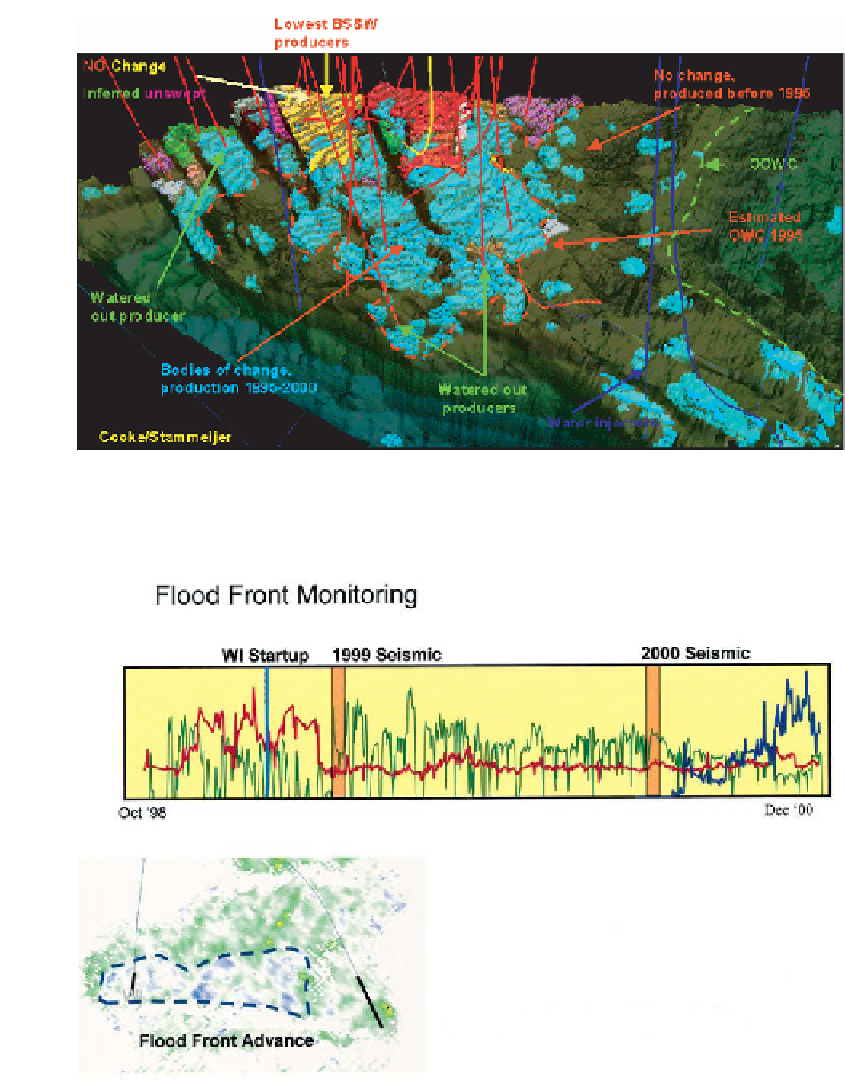
Fig. 8.6
Northern North Sea field. Perspective display of field structure, with wells and reservoir
bodies indicated. Blue bodies: oil swept between 1995 and 2000. Reproduced with permission from
Flood Front Monitoring
1999 Seismic
2000 Seismic
WI Startup
Dec '00
Oct '98
2000 -- 1993: Flood Front Visible
Fig. 8.7
In the upper graph, green is oil production rate, blue is water production rate and red is
the gas-oil ratio of the produced fluid. The difference map of amplitudes between the 1999 survey
and the 1993 pre-production baseline (not shown) revealed brightening due to gas coming out of
solution. The difference map between 2000 and 1993 shows brightening (green) in the peripheral
areas owing to gas evolution, but dimming (blue) around the water injector. The blue zone therefore
shows the position of the flood front in 2000, and is consistent with the subsequent water
breakthrough at the producing well.