Geoscience Reference
In-Depth Information
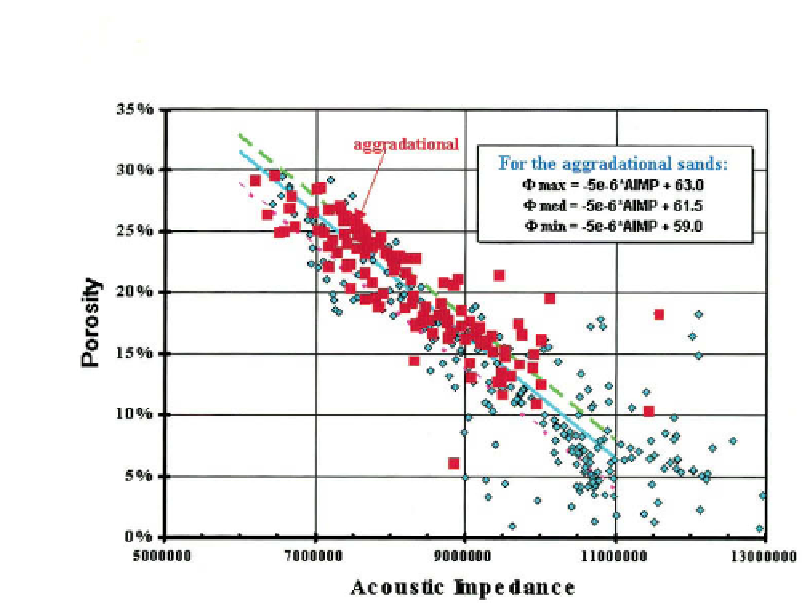
Estimated relationships between
porosity and acoustic impedance of the
Fulmar sands
35%
aggradational
For the aggradational sands:
30%
Φmax = -5e-6* AIMP + 63.0
Φ
med = -5e-6* AIMP + 61.5
Φmin = -5e-6* AIMP + 59.0
25%
20%
15%
10%
5%
0%
5000000
7000000
9000000
11000000
13000000
Acoustic Impedance
Fig. 6.7
Plot of acoustic impedance versus porosity in Fulmar sands (UK North Sea), based on
several wells.
to be discontinuous, making them less effective as baffles to prevent early water influx
into producing wells than had been hoped.
6.3.2
Stochastic inversion
Seismic information can be incorporated into a reservoir model by using geostatistical
methods; a useful introduction to this topic is provided by Chambers
et al
. (
2000
). The
problem in building a reservoir model is that there is usually only a small number of
well penetrations where reliable data on reservoir properties can be obtained directly.
To estimate the properties between the wells, it is necessary to understand their spatial
variability. As we move away from a well, the values measured there become less and
less useful as a way of predicting properties, but we need to know how quickly this
fall-off in predictive power happens. Data can be analysed using variograms, which
are plots showing how the dissimilarity of a property increases with distance from
an observation point; they can be created by comparing properties measured in pairs
of wells at different distances apart. The range at which the dissimilarity reaches a
constant high value tells us how far away from a well it is reasonable to extrapolate the
properties measured there. If this range is, say, several kilometres, then interpolation