Geoscience Reference
In-Depth Information
which allows us to calculate fractional change in impedance as a function of time by
integrating reflectivity from a starting time
t
0
at which we know the impedance
A
(0);
the unknown scaling constant prevents us from turning this into absolute values of
impedance. The SAIL trace results will clearly be limited to the seismic bandwidth.
Isolated interfaces where there is a large impedance change, such as the top of a massive
carbonate within a dominantly shale sequence, will show up as the band-limited version
of a step function, which is a bipolar loop. A limitation is the assumption that the seismic
wavelet is zero-phase; if at all possible, this needs to be checked by means of a well tie.
A particularly useful formulation of this approach can be derived by thinking of
the reflectivity trace in the Fourier domain, i.e. as the summation of a number of sine
waves of different frequencies and phases. Integration of an individual component sine
wave of frequency
gives a sine wave whose phase has been shifted by 90
◦
and whose
amplitude has been multiplied by 1
ω
. Integration of the entire trace requires that
this process should be applied to every individual sine wave component. Therefore,
the seismic trace can be integrated by applying a phase shift of 90
◦
and a high-cut
filter that falls off as 1
/ω
across the entire seismic bandwidth, i.e. at 6 dB per octave.
Many interpretation software suites contain the functionality to process seismic data in
this way, so SAIL traces can be easily generated without the need for any additional
processing software.
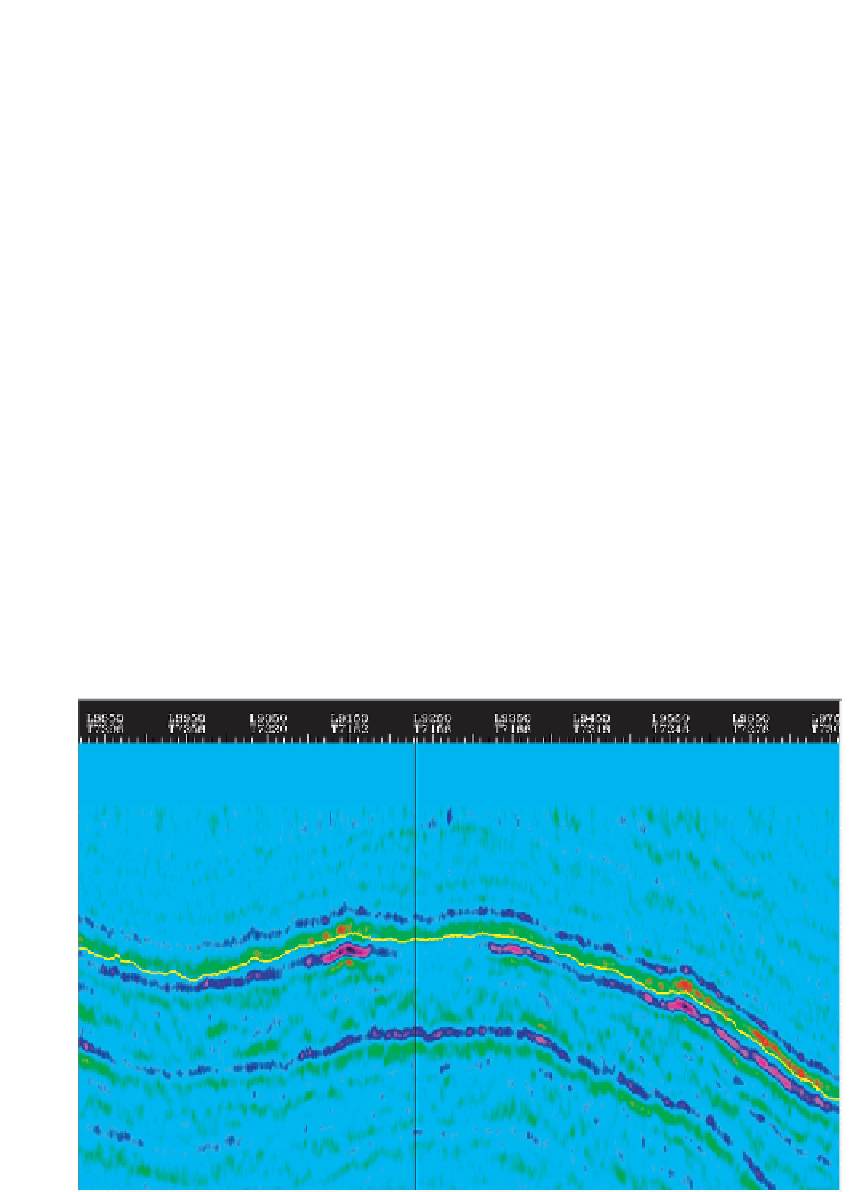
Figure 6.2
is an example of what can be achieved by this means. It is a seismic line
across an area of the Central North Sea, offshore UK. The horizon picked in yellow
/ω
Fig. 6.2
Band-limited inversion result, produced at the workstation using the SAIL methodology.