Geoscience Reference
In-Depth Information
(a)
0
−
0.2
brine
−
0.4
−
0.6
G
−
0.8
oil
1
−
−
1.2
−
1.4
−
1.6
−
0.1
0
0.1
0.2
0.3
0.4
0.5
R
0
R
0
(b)
G=
−
3.91R
0
or 0.256G=
R
0
0.256=sin
2
(30.4
°
)
−
Applying R
0
+0.256G makes
all points on the line zero
points away from the line
will be
−
ve or
+
ve
G
This can be viewed as a
projection
Projection axis
R
0
R
0
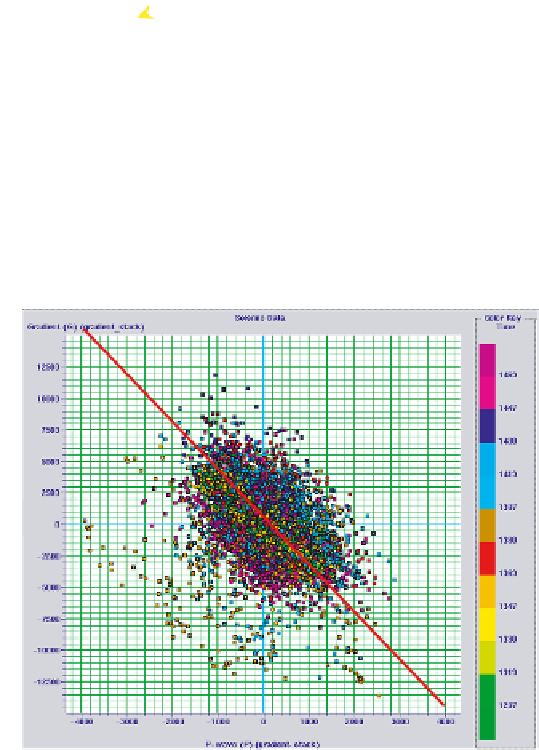
Fig. 5.15
(a) and (b) Examples of intercept-gradient crossplots for top sand in brine and oil cases.
Shuey's equation, we see that this is equivalent to creating a stack at some particular
angle of incidence. An angle stack for a small range around this value would therefore
be the best way of looking for pay sand. Various 'fluid factor' discriminants have been
proposed along these lines, but in practice it is better to make a crossplot of the real
seismic data and choose the best angle stack by the calculation shown in
fig. 5.15(b)
.
Note that in this example, the slope of the trend line is quite high at about
−
4. This
means that an angle stack at around 30
◦
would be the best fluid discriminant. Modelling
the expected trend based on well data, considering the effects of varying porosity and