Geoscience Reference
In-Depth Information
26/4-2
25/6-3
25/5-2
25/5-1
25/2-6
25/2-14
25/2-7
25/3-1
Sele Fm
S2
S1
Wireline log
scale
Lista Fm
Core
Facies
Channel
Splay
Background
Gamma-ray log
(scale not shown)
Retreat
= 25m
Growth
Initiation
Sonic log
(scale not shown)
25/2-6
25/5-1
26/4-2
25/6-3
25/5-2
25/2-14
25/2-7
Sediment
remobilisation
25/3-1
Channel
Avulsion
Well with
Hermod cores
Well in
channel axis
N
Background
sediments
(Sele Fm)
Splay
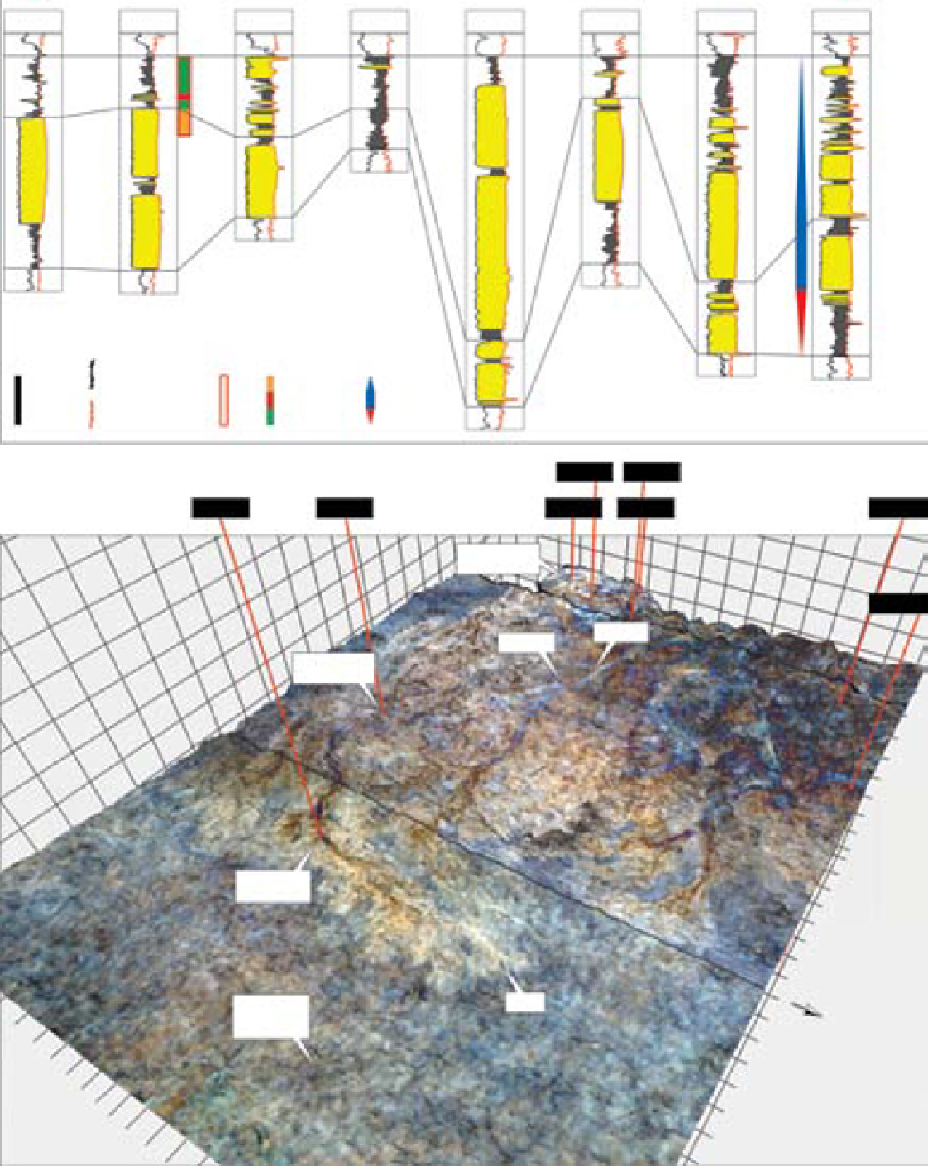
Fig. 4.
above: Hermod sandstones represented in yellow between sonic and gamma ray logs for the same well as dis-
played in the 3d view above. Well spacing ranges from well 22 km (from well 25/2-14 to well 25/3-1) to 2 km (the distance
between the Hermod Member type well 25/2-6 and the nearest offset well 25/2-14). Note that some of the wells are drilled
in an area where post-depositional sediment injection and evacuation has been interpreted and the vertical successions
observed in these wells have not been used for analysis of sandstone stacking patterns. Only the two wells in the north-
western corner of the study area (i.e. 25/2-7 and 25/3-1) and the two wells in the south-eastern corner (i.e. 25/6-3 and 26/4-2)
are believed to represent (mostly) in situ sediments. Below: 3d illustration of the present day time-structure relief of the
Top Sele Formation seismic reflector with colours extracted from the Hermod Member as it appears on a blended spectral
decomposition volume (10/11/13Hz). The primary depositional architecture of the Hermod Member is dominated by chan-
nels with terminal splays and, locally, the occurrence of irregularly shaped mounds interpreted as sediment remobilisation
Search WWH ::

Custom Search