Geoscience Reference
In-Depth Information
1°
2°
3°
4°
EAST SHETLAND
BASIN
Study area
Hermod Fan
EAST
SHETLAND
PLATFORM
NORWAY
60°
N
STORD
BASIN
NORWAY
SWEDEN
UK
DENMARK
0
50 km
59°
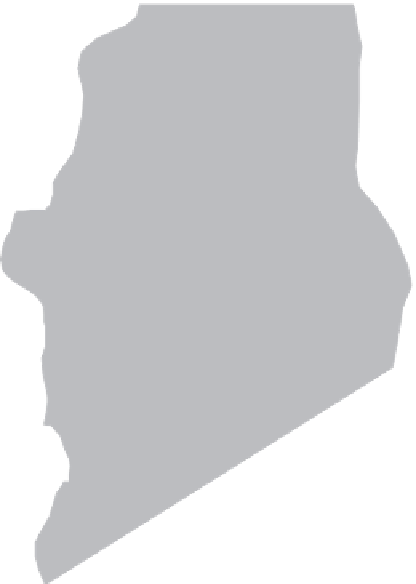
Fig. 1.
Location map of the study area with main structural elements and gross outline of the studied Hermod Member
submarine fan complex. The studied 'tongue-like' mid-fan to outer-fan follows the grain of a family of faults that concur
with the northern rim of the Utsira High and a step-over zone in the segmented Viking Graben.
DATA AND METHODOLOGY
(hereafter referred to as the RGB blend in text and
figures). The noise-cancelled seismic data facili-
tated precise auto tracking of key seismic reflec-
tors, resulting in detailed isochron maps that
clearly mimic depositional elements and post-
depositional sediment remobilisation structures.
The combination of the isochron maps and the
RGB blend provided an efficient tool for the assess-
ment of the internal geometries of the Hermod
Member (Fig. 3). a combination of various SVI
Pro© edge attributes was also applied to the seis-
mic dataset as a quantitative approach for the
detection of steep-sided mounds and pockmarks.
The optimal seismic imaging was achieved in
the mid to outer fan area. The seismic representa-
tion of the more proximal parts of the fan tends to
be rather poor, especially in places where the
Frigg Sandstone Member overlies the Hermod
a standard subsurface work-flow, involving
detailed core description tied to well logs, well
correlations, well-seismic ties and seismic inter-
pretation, was performed in the mid to outer fan
area. The only Sele Formation core from this area
is from well 25/6-3 and covers 45 metres of sand-
stone and shale. The seismic interpretation was
performed on two 3d datasets; UHN98R07 and
EN0101, which collectively cover a total area of
1734 square kilometres. These datasets were opti-
mised for seismic stratigraphic analysis through
the application of a combination of geophysical
techniques including random and coherent noise
cancellation, spectral enhancement, spectral
decomposition (Partyka
et al
., 1999) and Red-
Green-Blue (RGB) volume blending in SVI Pro©


Search WWH ::

Custom Search