Geoscience Reference
In-Depth Information
(A)
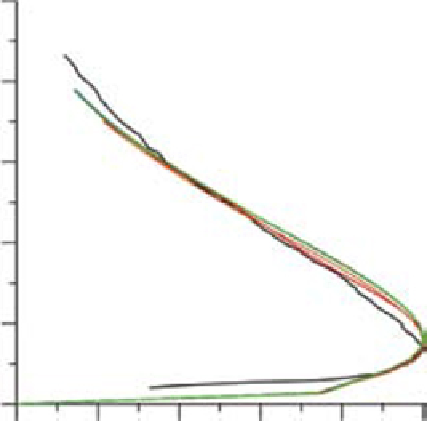
(B)
Simulated Average Velocity Profile
in the Body of the Current
Non-dimensional Average Velocity Profile
in the Body of the Current
0.12
2
1. 6
0.08
1. 2
0.8
0.04
0.4
0
0
0
0.4
0.8
Velocity (ms
−1
)
1. 2
0
0.2
0.4
0.6
0.8
1
Non-dimensional velocity
UVP Velocity Profile
DefaultParametersTlen0.0002
Bedload5PickUp0.18 Tlen0.0025
Bedload1PickUp0.18Tlen0.003
Bedload0.2PickUp0.18Tlen0.0025
Bedload0.001PickUp0.18Tlen0.0025
Fig. 6.
(A) Velocity profiles for the body of a one-grain-size turbidity current, averaged on a 53 second period for the differ-
ent numerical runs of Table 1B. (B) Non-dimensional velocity profiles for the body of a one-grain-size turbidity current,
averaged on a 53 second period for the different numerical runs of Table 1B.
the UVP probe inclination. To illustrate that the
remaining misfit is a problem of precision of the
dimensionalisation of the boundary conditions
and not due to the inability of the model to simu-
late a turbidity current, Fig. 6B shows a comparison
between the UVP velocity profile and the simula-
tion using the default parameter settings, where the
velocity and spatial axes of both profiles have been
non-dimensionalised with the maximum velocity
and the y
0.5
(the height at which the velocity at the
top of the flow decreases to 50% of the maximum
velocity; see Kneller & Buckee, 2000). The observed
fit in the shape of the velocity profile is near-exact.
Even without non-dimensionalisation, all the
simulations, while changing some of the numerical
parameters, show a similar shape and comparable
velocity values. For all the cases listed above,
changing the numerical parameters does affect the
results; nevertheless, all the simulated velocity
profiles match rather well to the observed values.
This is a proof of the reliability and robustness of
the software which, given the proper boundary
conditions, is capable of reproducing the flow
behaviour of turbidity currents with initial vol-
ume concentrations of 13% in a situation as
described here.
Case Study I-c: Body of the flow - bi
dispersed mixture
A crucial step for the numerical investigation is the
analysis of a multi-species case, where a grain size
mixture is present in the flow. This was performed
by adding to the previously described runs another
species with a grain size of 144 µm. Once again, the
velocity profiles for the body of the current, aver-
aged over a period of 53 seconds, are reported at the
location of the UVP probes, 2.6 m from the inlet.
The boundary conditions for this experiment are the
same as the ones described above, as well as the
total sediment concentration, with the exception
that now there are 2 grain species in the mixture.
The concentration is equal to Case Ib, reported
above. The velocity profiles are shown in Fig. 7.


Search WWH ::

Custom Search