Geoscience Reference
In-Depth Information
Table 1.
(A) Case study I-a. Summary of the performed CFD simulations of Run 15 in the laboratory experimental study.
(B) Case Study I-b-c. Summary of the performed CFD simulations of Run 36 in the laboratory experimental study; one grain
size. The irst ive rows refer to a mono disperse mixture d50 = 50 µm; the last four rows to a bi-disperse mixture d50 = 50 µm
and d50 = 144 µm).
A
Bedload
coefficient
Entrainment
coefficient
Turbulence Mixing
Length (m)
Angle of
Repose (deg)
Roughness (mm)
Run15a
8
0.018
0.0025
25
0.165
Run15b
8
0.018
0.0025
25
0
Run15c
0
0.018
0.0025
25
0.165
Run15d
4
0.018
0.0015
25
0.165
Run15e
12
0.018
0.0015
25
0.165
Run15f
8
0.01
0.0025
25
0.165
Run15g
8
0.025
0.0015
25
0.165
Run15h
8
0.018
0.0015
25
0.165
Run15i
8
0.018
dynamically
computed
25
0.165
Run15j
8
0.018
0.0025
12
0.165
B
Bedload
coefficient
Entrainment
coefficient
Turbulence mixing
length (m)
Angle of
repose (deg)
Roughness (mm)
36a
8
0.018
0.002
25
0.144
36b
5
0.018
0.0025
25
0.144
36c
1
0.018
0.003
25
0.144
36d
0.2
0.018
0.0025
25
0.144
36e
0.01
0.018
0.0025
25
0.144
36
2 grains a
8
0.018
0.001
25
0.144
36
2 grains b
8
0.018
0.0015
25
0.144
36
2 grains c
8
0.018
0.002
25
0.144
36
2 grains d
8
0.018
0.001
25
0.25
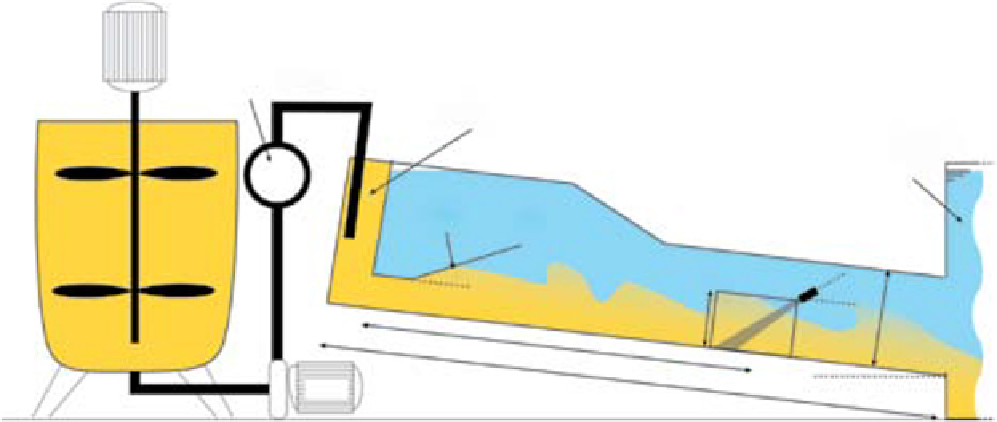
Discharge meter
Inlet chamber
Free expansion tank
3
×
2
×
1.8 m
D
Mixing
tank
Gradual expansion
1 m
3
25°
UVP-probe
45°
0.5 m
Pump
Fig. 1.
Sketch for the experimental set-up used for the high concentration turbidity currents experiments.


Search WWH ::

Custom Search