Geoscience Reference
In-Depth Information
(A)
2/4-12
-130
3100
1. 95 Density 2.95
Top Ekofisk Fm
-0.15 Porosity 0.45
Gamma
0 Ray 30
3150
Top Tor Fm
0
3200
50
0 m
+130
Core Interval
Interpreted limit of the channel structure
(B)
-130
0
0
50
+130
Initial erosive surface
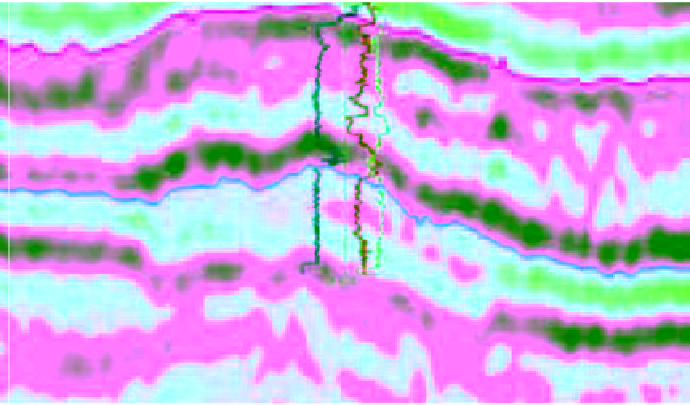
Fig. 6.
(A) Seismic Section B of Fig. 5 calibrated to well 2/4-12. Note the positive amplitude (light grey to black colours)
and negative amplitude (orange to red colours) reflections defining the lower and the upper channel-fill unit, respectively.
The strong positive reflection at the base of the Ekofisk Formation, directly above the top Tor Formation horizon (green
line), is generated by the density contrast between the Ekofisk dense zone and underlying porous Tor Formation. This
transition from the porous Tor Formation to the overlying Ekofisk dense zone can be seen clearly on the density and
porosity logs. The Ekofisk dense zone is characterised by high gamma ray values due to its higher argillaceous content.
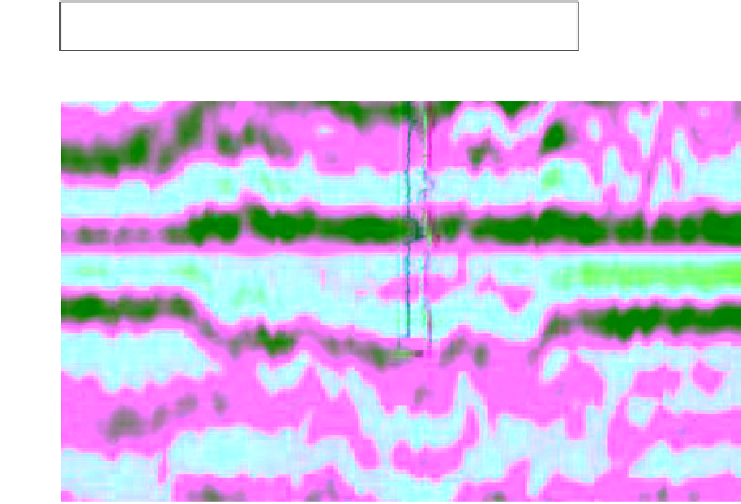
(B) Seismic Section B of Fig. 5 flattened at Top Tor Formation. Amplitudes are given as unitless.
nearly 5 km in the central segment. Farther
towards the ESE, the channel margins are roughly
parallel, with the southern margin being fairly
straight and the northern margin showing minor
irregularities (Fig. 4). The channel-fill seismic
facies in the central segment change from flat and
uniform to chaotic, convoluted or discontinuous
reflections (Fig. 5C). The channel-fill shows
NE-inclined reflections, dipping from the southern
margin towards the channel axis (Fig. 5D). The


Search WWH ::

Custom Search