Geoscience Reference
In-Depth Information
(A)
(B)
Cross-set thickness distribution
Cross-set volume distribution
100
100
Line pinning point for
EF
(
v
max
) =
EF
(
x
max
)
and estimated
v
min
D
1
Best-fit lognormal curve
log
C
Power-law (linear)
approximation
Line gradient (
G
) calculated
from the values of
D
1
and
D
2
G
D
2
Measured data range
Cut-off limit
EF
(
v
min
) =
EF
(
x
min
)
0
0
log
x
log
v
0
Measured maximum
Possible 'absolute' maximum
Limit from
dune definition
Estimated
v
min
Expected
v
max
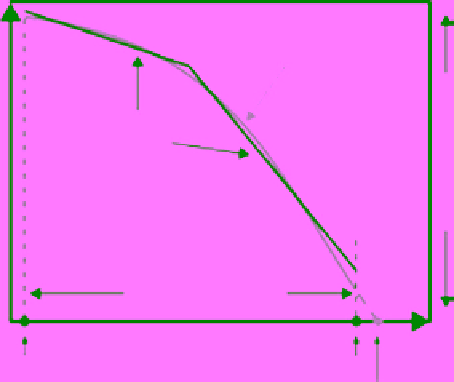
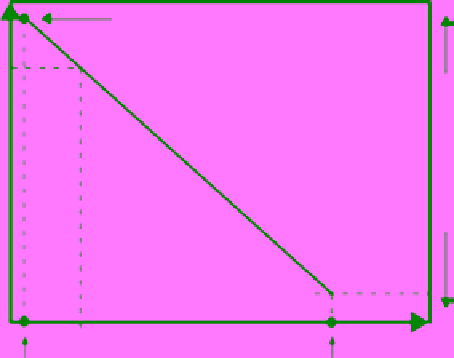
Fig. A-7.
Diagrams showing how of a lognormal bed-thickness frequency
EF
(
x
) approximated as a two-tier power-law
distribution (A) allows the bed-volume frequency distribution
EF
(
v
) to be determined and numerically constrained (B).
which, in a log-log plot, defines a straight line
(Fig. A-7B):
x
max
= 2.5 m, which gives
γ
= 0.56. From equation
A7, one can expect that the bed-thickness distri-
bution will thus have two exponents:
(A12)
log
EF v
()=
log
C Gv
−
log
i
i
DG
=+−
(
12 2
forthe thinnerbeds
12 forthe thicke
γ
)
γ
(
xx
≤
)
1
b
The exponent
G
(negative value) defines the
distribution line gradient and the slant line is
constrained further as follows (Fig. A-7B):
The frequencies of the volumetrically smallest
and largest beds,
EF
(
v
min
) and
EF
(
v
min
), are assumed
to be the same as those of the thinnest and thickest
beds,
EF
(
x
min
) and
EF
(
x
min
), since the thinnest beds
are expected to be the smallest and the thickest
beds to be the largest.
The horizontal co-ordinate of the line's left-hand
pinning point is the lower cut-off limit log
v
min
,
calculated for an estimated
v
min
(see below).
The line's coefficient log
C
is the value of
log
EF
(
v
i
) corresponding to log
v
i
= 0.
The
v
min
value for dune cross-sets can be indi-
rectly estimated by using the Flemming empirical
formula (Ashley, 1990, Fig. 9A):
DG
=+
(
γ
)
rrbeds(
xx
b
>
)
2
(A9)
Malinverno (1997) had tested this observation
with a simple numerical experiment and rear-
ranged the two equations to obtain the unknown
exponent
G
from the known values of the expo-
nents
D
1
and
D
2
of bed-thickness distribution
(with
D
2
>
D
1
, Fig. A-7A):
D
DD
G
=
+−
2
(A10)
1
2
1
For the bed-thickness dataset in the present case,
this exponent is
G
= 0.93 and allows us to deter-
mine the frequency distribution of bed volumes,
EF
(
v
i
).
h
= 0 0677
.
L
0 8098
.
(A13)
to derive the dune wavelength (
L
) for dune min-
imum height (
x
min
) and take this value to approx-
imate the dune breadth as
w
≈ 2
L
. The
wavelength for
h
= 0.07 m is
L
= 0.96 m and the
corresponding dune volume can be calculated
from the geometrical equations in Figure A-4B,
which yields
v
min
= 0.16 m
3
. The right-hand limit
The derivation of bed-volume frequency
distribution
The exceedence frequency distribution of bed
volumes has the following general form:
−
G
EFv v
i
()=
(A11)
i
Search WWH ::

Custom Search