Geoscience Reference
In-Depth Information
In general, the exponent
D
will not be equal to
the corresponding exponent
G
, unless
γ
= 0 or
2
G
=
Z
. As pointed out by Malinverno (1997), the
exponent
γ
will be zero only if all beds cover the
same area irrespective of their thicknesses, which
means a peculiar case. Likewise, the equality 2
G
=
Z
might hold in some unusual case but there is no
obvious reason to assume that the scaling of bed
breadth with bed thickness is related to the spatial
distribution of the bed centres. In short, one cannot
infer the frequency distribution of bed volumes
from the distribution of bed thicknesses alone; for
this purpose, something must be known or assumed
about the scaling of bed breadth with bed thickness
and about the spatial distribution of bed centres.
(A)
(B)
r
r
M
(
r
) = const.,
Z
= 0
M
(
r
) ~
r
,
Z
= 1
(C)
(D)
r
r
The estimation of exponents
γ
and G
In statistical terms, the vertical stacking of dunes
into a tidal sand ridge can be compared to the drop-
ping at random of a large number of 'inverted-saucer'
beds (Fig. A-2) of various sizes onto an elongate,
elliptical area that is at least as wide as the largest
bed breadth (Fig. A-6D). The pertinent question is as
to what will be the frequency distribution of the bed
thicknesses measured along a vertical sampling line
through such a dune complex.
Equation A7 shows that the exponent
D
of the
bed-thickness frequency distribution depends on
the exponent
G
of the bed-volume frequency distri-
bution, on the exponent
γ
relating bed thickness
and breadth (Fig. A-3A) and on the exponent
Z
of
the spatial distribution of the bed centres (Fig. A-6).
Malinverno (1997) distinguished two limiting
cases for the spatial distribution of the bed centres
confined to an area. If the bed breadth is
w
≥ ½
w
max
,
the bed will always be intersected by a vertical
sampling line located near the area centre (which
means
Z
≈ 0; Fig. A-6A). If the bed breadth instead
is
w
<
w
max
, the bed centre is no longer constrained
to be close the area centre (which means
Z
≈ 2; Fig.
A-6C). The spatial distribution of bed centres con-
fined to an elongate tidal ridge will represent an
intermediate case (Fig. A-6D), where the exponent
Z
can be any non-integer value between 1 and 2.
As for the two limiting cases, Malinverno (1997)
had shown that their transition would occur at the
'break-point' value
x
b
of bed thickness, defined as:
M
(
r
) ~
r
1. 5
,
Z
= 1. 5
M
(
r
) ~
r
2
,
Z
= 2
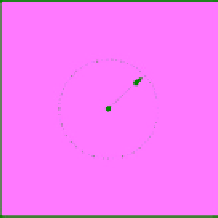
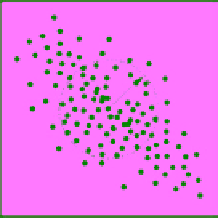
Fig. A-6.
The spatial distribution of bed centres (black
dots) in plan view; slightly modified from Malinverno
(1997, Fig. 8) (A) If all the bed centres have the same loca-
tion in the horizontal plane, the number of centres
M
(
r
)
within a circle of radius
r
is constant and the exponent
Z
= 0. (B) If the bed centres are clustered along a line,
M
(
r
) ≈
r
and
Z
= 1. (C) If the bed centres are scattered randomly,
M
(
r
) ≈
r
2
and
Z
= 2. (D) If the bed centres are clustered within
an elliptical area, the parameters will be intermediate, such
as
M
(
r
) ≈
r
1.5
and
Z
= 1.5.
is expected to depend on several factors, each quan-
tified by a different dimensionless exponent: the
scaling between the bed breadth and central thick-
ness, quantified by
γ
(
γ
≥ 0); the lateral decrease in
bed thickness with distance from the bed centre,
quantified by
α
(
α
> 0); the frequency distribution of
the bed volumes, quantified by
G
(
G
> 0); and the
spatial distribution of the bed centres relative to
the sampling line, quantified by
Z
(0 ≤
Z
≤ 2).
Malinverno (1997) has demonstrated that the
general formula relating these exponents to the
exponent
D
has the following form:
DG GZ
=+ −
γ(
2
)
(A7)
This equation shows that the details of bed shape
may actually be irrelevant, so long as the shape of all
beds is roughly the same and is adequately approxi-
mated for some value of
α
> 0 (Fig. A-3B). The latter
coefficient is not involved in the equation.
x
b
= 037
1
.
/
γ
x
(A8)
max
where
x
max
is the measured maximum bed thick-
ness. In the present case,
x
b
= 0.43 m
and


Search WWH ::

Custom Search