Geoscience Reference
In-Depth Information
(A)
-
∆
v
Shape approximation
Typical 'true' shape
+
∆
v
h
DUNE
Parallel to flow
-
∆
v
+
∆
v
+
∆
v
h
Tr ansverse to flow
Volume unaccounted for (-
∆
v
)
≈
Volume artificially added (+
∆
v
)
(B)
30°
w
w
w
w
4
h
h
h
A
=
1. 4h
2
A
=
h
2
/
1. 15
Estimated dune volume:
v
=
v
1
-
v
2
-
v
3
v
1
= 0.25 (
w
2
h
)
v
2
= 0.75
A
w
v
3
= 0.25
A
w
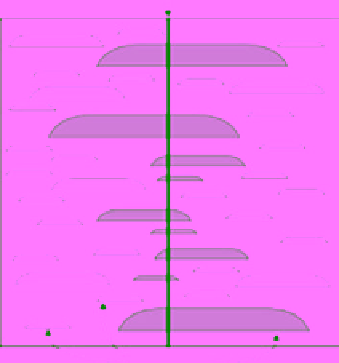
Fig. A-4.
(A) In the bed shape considered (Fig. A-2), the dune volume unaccounted for is compensated by the volume artificially
added by the 'inverted-saucer' approximation, whereas the notion of a central maximum thickness can be replaced with the
notion of a representative prevalent thickness. (B) Diagram explaining how the volume of a dune-enclosing cylinder is geometri-
cally reduced to approximate the idealised shape of a dune that has migrated slightly in excess of its double wavelength.
the number of bed centres whose lateral distance
from the sampling line is less than
r
i
and he assumed
that this number is proportional to some power of
r
i
:
Sampling line (well)
Mr r
(A5)
()
Z
i
≈
i
where the value of exponent
Z
is between 0 and 2
(Fig. A-6). If all the bed centres were located at the
same point in a horizontal plane and coincided
with the location of the sampling line,
M
(
r
) would
be a constant and
Z
= 0 (Fig. A-6A). If the bed cen-
tres were located along a line in the horizontal
plane,
M
(
r
) would be linearly proportional to
r
and
Z
= 1 (Fig. A-6B). If the bed centres were scat-
tered randomly in the horizontal plane,
M
(
r
)
would be proportional to
r
2
and
Z
= 2 (Fig. A-6C).
In the present case of dunes clustered into elon-
gate sand ridges, an intermediate relationship
would be more appropriate, such as
M
(
r
) propor-
tional to
r
1.5
and
Z
= 1.5 (Fig. A-6D).
Sandstone
beds
Fig. A-5.
Hypothetical cross-section through a strati-
graphic succession intersected by vertical sampling line
(slightly modified from Malinverno, 1997, Fig. 9). Note
that there are many more thin than thick beds in the suc-
cession but the sampling line intersects the same number
of both because of their different lateral extent.
The relationship between D and G
whereby the distribution exponent for the measured
bed thicknesses would be the same as that expected
for the bed-centre maximum
h
-values (eq. A4).
To quantify the spatial distribution of bed centres
in a plan view, Malinverno (1997) defined as
M
(
r
i
)
According to the preceding conceptual notions,
the exponent
D
of the frequency distribution of
bed thicknesses:
−
D
EF xx
i
()≈
(A6)
i

Search WWH ::

Custom Search