Geoscience Reference
In-Depth Information
(A)
Initial morphology of the basin (T = 0)
(B)
Final morphology of the basin (T = 320 ka)
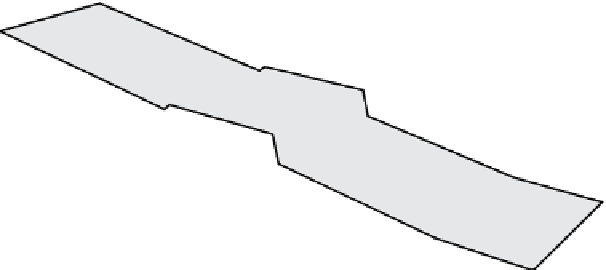
(C)
Final morphology of the extended basin (T = 320 ka)
Fig. 1.
Schematic diagrams of (A) the initial morphology, (B) the final morphology of the passive-margin model (these
parameters are defined from the parameters of the XES 02 experiments, Strong & Paola, 2008) and (C) the final morphology
of the extended source-to-sink model.
equal to the total number of cells in the strike
direction. On the opposite, in the case of a focused
flow, for example inside an incised valley, the
number of channels is very small and close to one.
The location of the centroid was also used
(Martin
et al
., 2009), that is the depositional cen-
tre of mass, to measure planview dispersion of
sediment in the experiment. This work has
improved a little upon the definition proposed
by Martin
et al
., 2009. The centroid position,
(X,Y), of a sedimentary layer is measured at the
time of its deposition and not at the end of the
simulation. This accounts for the spatial distri-
bution of erosion and deposition.


Search WWH ::

Custom Search