Geoscience Reference
In-Depth Information
Accordingly, the seismic sequences described in
this paper are divided according to the various
basin configurations and this subdivision is fur-
ther discussed in the discussion chapter.
Sequences of the latest syn-rift and early
post-rift stages: Basin configuration 1
In reflection seismic data, the Upper Jurassic
and Lower Cretaceous sequences are well imaged
across the entire study area. The structuring is
dominated by moderate faulting in the platform
areas and more intense deformation and develop-
ment of rotated fault blocks in the sub-platform
settings (Kyrkjebø
et al
., 2001), typical of the syn-
rift and early post-rift stages. In the northern North
Sea, part of the sediment was trapped in structural
lows on the northern Horda Platform (including
the Troll Field) whereas a considerable volume
bypassed the platform area (Gabrielsen
et al
.,
1990, 2001).
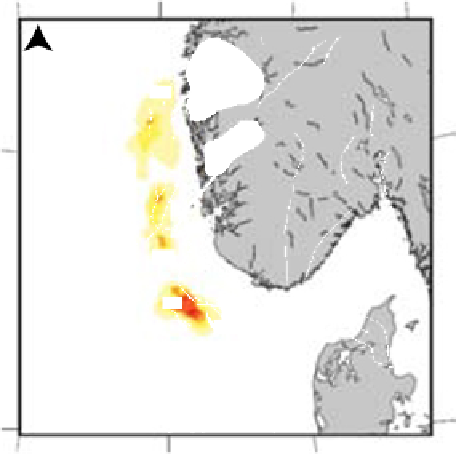
Outside the Viking Graben, four main prograda-
tional systems are recorded (Fig. 5A), namely in
the northern Horda Platform area (J-1), the Åsta
Graben and the Stord Basin areas (J-2.1) and in the
Egersund Basin (J-2.1 and J-2.2). The relationship
between sequences J-1 and J-2.1 is illustrated
in Fig. 6A. In the Norwegian-Danish Basin, the
Upper Jurassic and Lower Cretaceous successions
Seismic sequences
In this section, we present all the seismic sequences
which reflect the major changes in basin configu-
ration in the study area. The sequences are pre-
sented according to the basin configurations that
they are proposed to be related to. These include
(see Fig. 4) basin configuration 1, with sediments
deposited in the Late Jurassic and Early Cretaceous
sequences (J-1 to K-2, Fig. 4), basin configuration
2, reflected by the Late Cretaceous sequences
(K-3 to K-6; Chalk Group, Fig. 4), basin configura-
tion 3, represented by the Palaeocene and Eocene
sequences (CSS-1 and CSS-2; Fig. 4) and basin
configuration 4 which reflects the Late Palaeogene
to Pleistocene sequences (CSS-3 to CSS-10; Fig. 4).
Criteria for distinguishing these basin configura-
tions are further proposed and discussed in the
discussion chapter.
(A)
(B)
N
N
H
H
60°
60°
ESP
VG
ESP
VG
H
ÅG
PBR
PBR
Å
Å
Å
Å
Å
Å
Å
Å
Å
Å
Å
Å
Å
Å
Å
ÅG
E
E
E
E
B
E
E
B
E
B
E
E
E
E
B
FFZ
FFZ
LFB
L
B
F
B
F
B
F
B
LFB
LFB
B
NDB
NDB
C
G
C
G
RFH
56°
56°
100 km
RFH
100 km
0°
4°
8°
0°
4°
8°
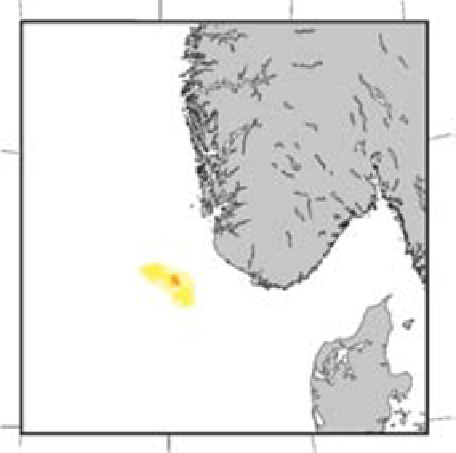
Legend
Source areas
Sediment transportation
> 200 ms TWT
> 400 ms TWT
> 600 ms TWT
> 100 ms TWT
> 300 ms TWT
> 500 ms TWT
> 700 ms TWT
Fig. 5.
Time-thickness maps, stage 1. Sequences J-1 and J-2 in (A) and sequence K-2.1 in (B). Abbreviations see Fig. 3.


Search WWH ::

Custom Search