Geoscience Reference
In-Depth Information
0
10
20
30
40
50
1. 0
Keep-up
0.8
0.6
Fill-up
0.4
0.2
Start-up
0.0
Time in hours
buttress
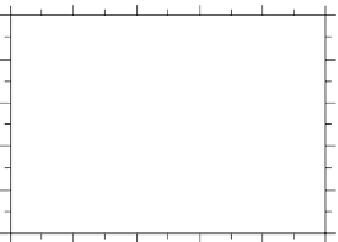
Fig. 3.
Schematic illustration of the stratigraphic development of a two-dimensional, fluvial sediment wedge in a duct of
0.11 m width and 4.5 m length. The changes from start-up, to fill-up and from fill-up to keep-up stages have been marked
by colours. The black lines are time lines at about 5 hour intervals. During the start-up stage the system progrades to base
level. Once its toe has reached base level the system will come in its fill-up stage and finally in its keep-up stage. The graph
in the inset shows the percentage of sediment bypass relative to what enters the system (based on Postma
et al
., 2008).
space in the fluvial realm continuously and
together control the ultimate gradient of the fluvial
system. Detailed studies of fluvial architecture in
the Rhine Meuse delta system in combination with
good age control have led Stouthamer & Berendsen
(2000, 2001, 2004 and 2007) and Van Asselen
et al
.
(2009) to relate avulsion frequency to these allocy-
clic controls. However, since the interplay of sea-
level, climate, local tectonics and regional tectonics
together defines the aggradation rate, it will always
remain challenging to unravel the relative contri-
butions of each from that which drives autogenic
behaviour directly: aggradation rate. For the geolo-
gist who wishes to predict fluvial architecture and
sandstone body connectivity, the direct relation-
ship between aggradation rate and frequency of
autogenic behaviour is thus an interesting one (cf.
Leeder, 1978), because it simplifies questions about
cause and effect. Aggradation rate can reasonably
be measured and bounding surfaces can be dated,
so prediction of autogenic behaviour can be done
on the basis of quantitative criteria.
dation rates do not vary linearly with sedi-
ment supply, as was demonstrated by simple
2-dimensional experiments performed in a duct of
0.11 m width and 6 m length (Postma
et al
., 2008).
The purpose of these experiments was to produce
fluvial stratigraphy by adding water and sediment
to the duct. It was found that channel aggradation
is predicted best by non-linear diffusion (Fig. 3).
For the two dimensional channel belt case, there
is increasingly more bypass with steepening of the
channel gradient, when the channel system is
building up to grade. Depending on the amount of
bypass, each channel system can be seen to pass
through three development stages: 1) a start-up
stage, in which the system aggrades towards base
level and during which no sediment can bypass
base level, 2) a fill-up stage, where the system
both aggrades and progrades beyond base level,
hence with sediment bypass up to the arbitrarily
chosen 90% level and 3) a keep-up stage, in which
less than 10% of the sediment input is used for
aggradation, whilst the rest bypasses the system.
Allogenic controls will force the system back and
forth between the start-up and keep-up stages
resulting in variation in aggradation rate and
related avulsion frequency. In the section below,
an estimate is made of this variation.
Aggradation rate
Aggradation or deposition rate is not to be
confused with sediment supply rate, since aggra-


Search WWH ::

Custom Search