Geoscience Reference
In-Depth Information
N
S
Well 6
Well 7
ca 2 km
ca 3 km
Well 5
Zone 9
Well 4
ca 3.5 km
Well 3
ca 4 km
Well 1
ca 2 km
Well 2
ca 2 km
Nansen Fm.
Zones
6-8
Eiriksson Fm.
Zone 5
Zone 4
1
2
Raude Fm.
Zone 3
100 m
Zone 2
Zone 1
GR & NPHI/RHOB
GR & NPHI/RHOB
0
GR & NPHI/RHOB
GR & NPHI/RHOB
GR & NPHI/RHOB
GR & NPHI/RHOB
GR & NPHI/RHOB
Increasing
A/S values
Mudstone with vertisol-like palaeosol
Channel sandstone
Bioturbated silty sandstone
Crevasse sandstone
Mudstone
Lacustrine deposit
Top Raude Formation
Top Eiriksson Formation
Overbank siltstone
A/S zone boundary
Decreasing
A/S values
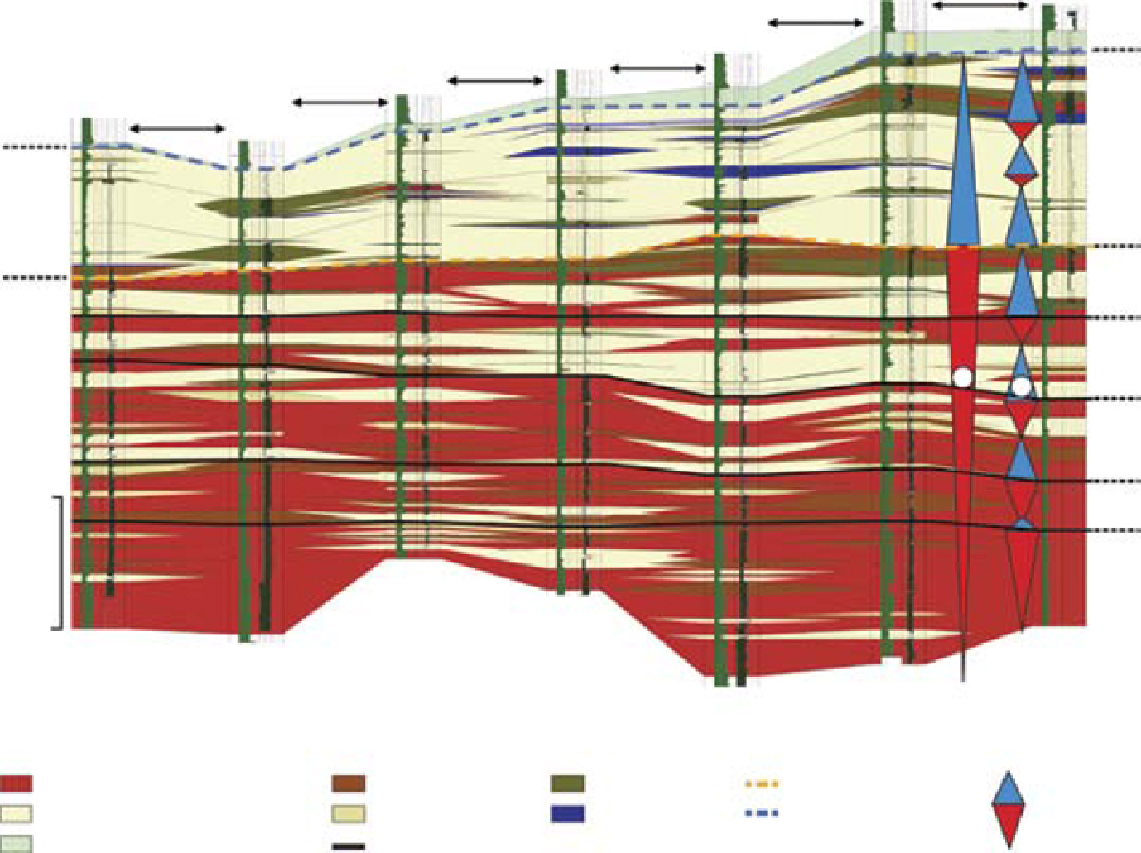
Fig. 12.
N-S correlation panel of cored wells of the Statfjord Group within the Statfjord Field. Horizontal A/S zone boundaries mark reservoir
subdivision (zone 1 to 9). A/S sequence symbols are equivalent to Fig. 5. 1 = Intermediate (intra Statfjord-) scale A/S cycle: upward more and
more amalgamated and laterally extensive channel belt deposits in the Raude Fm mark a decrease in A/S (although the long-term development
displays the opposite trend) and the minimum A/S is set equal to base Eiriksson Fm. 2 = Correlative A/S sequences on reservoir zone-scale (see
text).
Search WWH ::

Custom Search