Geoscience Reference
In-Depth Information
(A)
(B)
Well 1
Well 2
Higher level (27 m)
Lower level (33 m)
Higher level (27 m)
caliche
caliche
3900
3900
3905
3905
(8.5 m)
3910
3910
3915
3915
(11. 5 m)
3920
3920
(7 m)
3925
3925
caliche
caliche
3930
3930
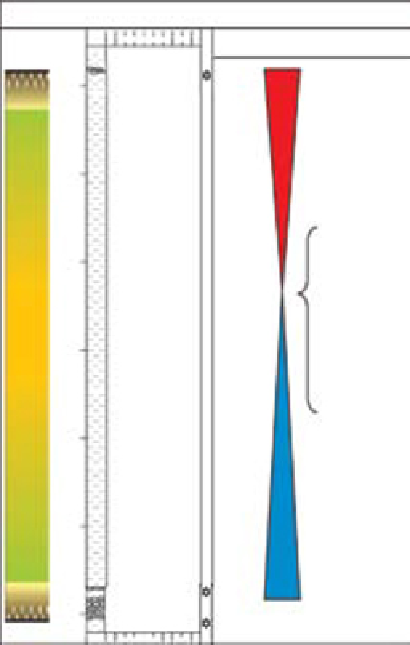
Fig. 10.
Principle of subsurface correlation using cores. (A) A mudstone-dominated A/S cycle in Well 1 formed by decreasing
palaeosol maturation values stratigraphically upward from a mature caliche horizon (indicated by the colour transition
from green to yellow) suggesting increasing A/S values. Subsequent increasing palaeosol maturation values (indicated by
the colour transition from yellow to green) suggest decreasing A/S values towards the next caliche horizon. White dots in
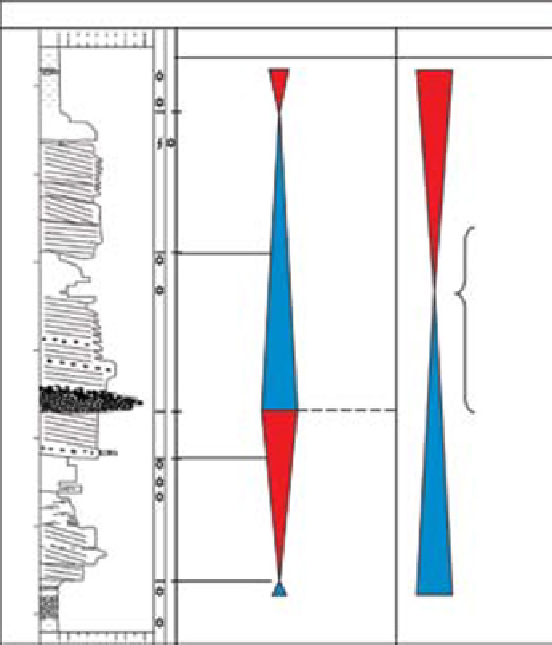
the brown-coloured interval indicate caliche in a mature palaeosol. (B) A higher-order sandstone-dominated A/S cycle in
Well 2 is superposed on the lower order mudstone-dominated cycle. Decreasing A/S values are interpreted from the
combination of i) increasing grain size, ii) decreasing sorting and roundness and iii) decreasing preserved set thicknesses.
Increasing A/S values are indicated by the reversed trend of the aforementioned parameters.
phenomenon. From the A/S relative minimum
upwards, an increasing A/S value is indicated by
either less mature palaeosol development (Fig. 12,
Well 1 overall trend) or by overall upward fining of
channel deposits (Fig. 12, Well 2 overall trend).
Correlation of stratigraphic sequences defined by
changes in A/S may occur across sedimentary
units with laterally marked lithological changes.
This can result in significant lateral variations in
A/S cycle thicknesses for higher-order cycles because
the base of sand-rich channel intervals, interpreted
to indicate the onset of a minimum aggradation
trend, are correlated to relatively thin, time equiva-
lent, palaeosols in other locations (Fig. 11A). The
Fig. 9.
An example of an interpreted cored well interval (well 3 of Fig. 12) covering reservoir zones 5 to 9 (uppermost part of
the Raude Fm and the Eiriksson Fm.; for location see Fig. 2). The stratigraphic understanding of the Statfjord Group is built
up stepwise. Architectural elements (2) are defined based on a descriptive subdivision of all core samples into lithofacies
(1) comprising the smallest definable building blocks of the reservoir and facies associations. Cyclic stacking patterns of
architectural elements (3) are interpreted in terms of changes in accumulation space and sediment supply as well as depo-
sitional breaks and erosion during sedimentation. This makes identification of marker horizons possible, which later define
reservoir zone boundaries (4). Reservoir zones defined in this way will consequently honour geological developments
through time instead of similar-looking lithologies.


Search WWH ::

Custom Search