Geoscience Reference
In-Depth Information
3.1.2 Stem-and-Leaf Plot
The 'stem-and-leaf plot' is useful to show both the data values themselves and
information about the distribution of the time series data. It is a useful method
for storing large datasets in a compact form while, at the same time, sorting
the data in ascending order (Walpole and Myers, 1985). A stem-and-leaf plot
(Fig. 3.3) is more useful in analyzing time series data than a histogram,
because it not only allows a visualization of the data distribution but also
enables the data to be reconstructed and lists the data points in the ascending
order (USEPA, 1996). However, the stem-and-leaf plot is one of the more
subjective visualization techniques as it requires the analyst to make some
random choices while deciding data interval on the stem. Therefore, some
practice or trial and error is necessary before a useful plot can be created by
this technique. As a result, the stem-and-leaf plot should only be used to
display the data distribution and their characteristics (USEPA, 1996).
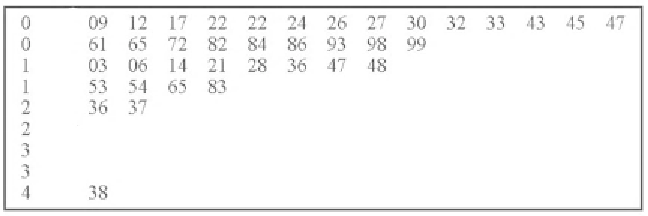
Fig. 3.3.
Example of a Stem-and-Leaf plot.
In the stem-and-leaf plot, each data point is partitioned in two parts: the
stem of the data point and the leaf. The leading digit of the numerical value of
the data point becomes the stem while the trailing digits become the leaf in the
order that corresponds to the order of magnitude from left to right. The stem
is displayed on the vertical axis and the data points make up the leaves on the
horizontal axis. The stem can be changed by increasing or decreasing the
digits that are used, dividing the groupings of one stem (i.e., all numbers
which start with the numeral 4 can be divided into smaller groupings), or
multiplying the data by a constant factor (i.e., multiply the data by 10 or 100).
Figure 3.3 presents a stem-and-leaf plot for a 38-year monthly rainfall time
series with 9 and 438 mm as minimum and maximum rainfall amounts of
monthly rainfall. Digits on the left side of vertical bar indicate stem with
interval of 50 mm while digits on the right side of the bar represent leaves.
Thus, the top-most leaves of Fig. 3.3 contain rainfall data below 50 mm while
the second row of leaves contains rainfall data between 50 and 100 mm. In
similar manner, the last row of leaves contain rainfall data less than 450 mm.
A stem-and-leaf plot roughly displays the data distribution and, hence,
helps identifying the underlying probability distribution. For example, the

Search WWH ::

Custom Search