Geoscience Reference
In-Depth Information
vulnerability measures. Assuming an expected value measure of vulnerability
is to be used, vulnerability can be expressed as follows:
T
[Sum of positive values of ( )]
Number of times an unsatisfactory
value occurred
xx
t
Vulnerability (
x
) =
(25)
Ë
Û
Ì
Ü
Í
Ý
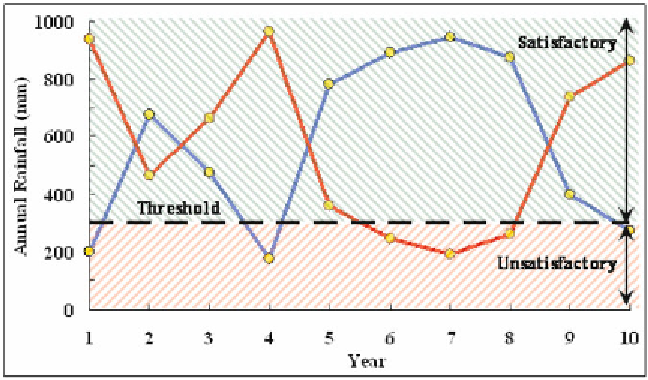
The expected vulnerability of the original blue time series (Fig. 2.7) is
[(300 - 200) + (300 - 175)]/2 = 125. Similarly, the expected vulnerability of
the time series shown by the red line in Fig. 2.7 is [(300 - 248) + (300 - 193)
+ (300 - 263)]/3 = 65.33.
Fig. 2.7.
Threshold value distinguishing values considered
satisfactory and unsatisfactory.
Thus, depending on whether a threshold value is considered a failure or
not in the above example, the 'reliability' and 'resilience' of original time
series (blue line) is equal or more than the rotated time series (red line).
However, the expected vulnerability of the original time series is more than
that of the rotated time series. It shows the typical tradeoffs researchers/
scientists or decision makers can identify using these three measures of system
performance. Note that the above-mentioned three measures of system
performance 'reliability', 'resilience' and 'vulnerability' (R-R-V) in a combined
form are used as a sustainability criterion for assessing the sustainability of
existing water resources systems (Loucks, 1997; Kay, 2000; Kjeldsen and
Rosbjerg, 2001). The interested readers are referred to Kjeldsen and Rosbjerg
(2004) for the application of 'reliability', 'resilience' and 'vulnerability' (R-R-
V) measures to real-world hydrologic time series and their comparative
evaluation. Recently, a cohesive approach for considering and expressing
various aspects of system resilience has been proposed by Wang and Blackmore
(2009) focussing on water resources systems.
Search WWH ::

Custom Search