Geoscience Reference
In-Depth Information
mm; 4.4% showed changes varying from -250 to -150 mm; 56.9% of the
Nigeria landscape experienced changes between -150 and -50 mm; ± 50 mm
occurred on about 34.6% while only 1.6% of Nigeria showed changes in the
positive direction from +50 to +150 mm.
12.4.3 Rainfall Cycles and Periodicities
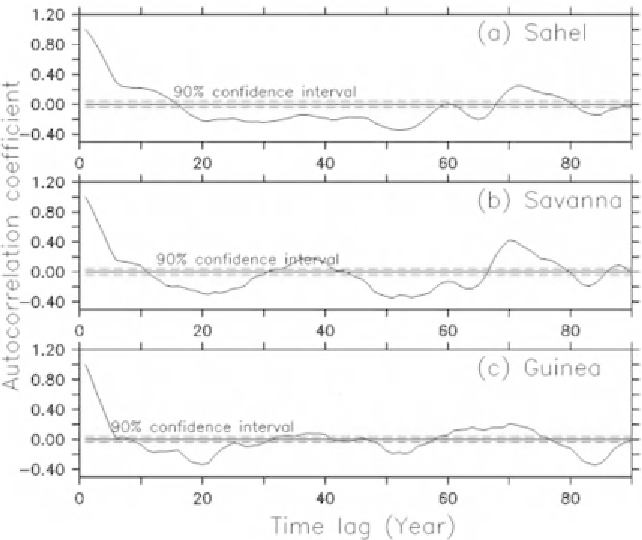
Autocorrelation plots for annual rainfall time series in Sahel, Savanna and
Guinea zones
are presented in
Figs 12.13(a-c). The annual rainfall time series
has an underlying sinusoidal pattern, because it exhibits alternating sequence
of positive and negative correlation values, and the values are not decaying to
zero. Such a pattern is signature of an autocorrelation of sinusoidal model.
However, the signal has different strength over the zones, the strongest over
Savanna and the weakest over Sahel. It is worth mentioning that this signal
only emerges after applying a 5-year moving average to filter out the noise in
the dataset. Without the filtering, the rainfall series over the zones is better
classified as random; but the filtering enhance the performance of the
autocorrelation analysis in revealing hiding periodic signal in the rainfall
series. However, it is difficult to describe the characteristic of the periodic
signal using the autocorrelation plots. This is better done with spectral analysis.
Fig. 12.13.
Autocorrelation coefficients of annual rainfall over (a) Sahel,
(b) Savannah and (c) Guinea zones (5-year moving average
was applied to the rainfall data).
Search WWH ::

Custom Search