Geoscience Reference
In-Depth Information
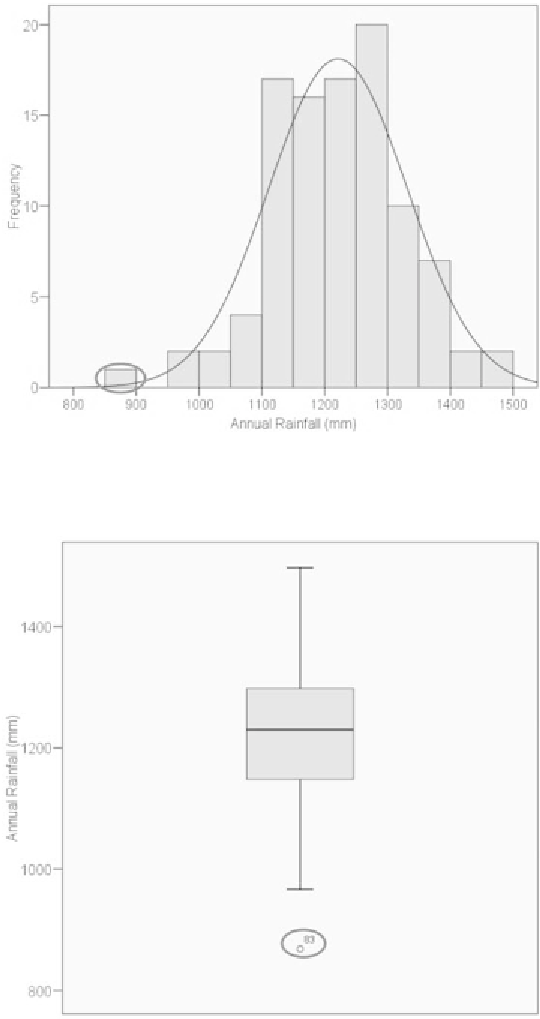
Fig. 12.3.
Histogram for annual rainfall time series of Nigeria to be used as a
check of normality (the outlier is enclosed in the oval shape). The histogram
is overlay with the theoretical normal distribution curve.
Fig. 12.4.
Box plot for annual rainfall time series of Nigeria to be used as a
check for normality (the outlier is encircled and corresponds to the annual
rainfall of year 1983).
Search WWH ::

Custom Search