Geoscience Reference
In-Depth Information
in Cohn and Lins (2005) was used except that the non-normality of low flow
time series was taken care of by adopting a three parameter gamma marginal
distribution. For these two tests, estimates of trend significance were obtained
with the assumption of LTP only if the estimated value of
H
was greater than
0.5, otherwise STP was assumed (i.e., MMK1 for the case of MKS test and
AR(1) process in the case of ALRT). Collective results of trend significance
were considered under the name of the LTP based test for the sake of discussion
and convenience of presentation. Similar to the MMK1 test, an estimate of
linear trend using the Sen's slope estimation technique was removed from
observations before applying the MKS test. It must be noted that for the case
of ALRT, the magnitude of linear trend as well as model parameters were
estimated by optimizing the likelihood function of the FARIMA model.
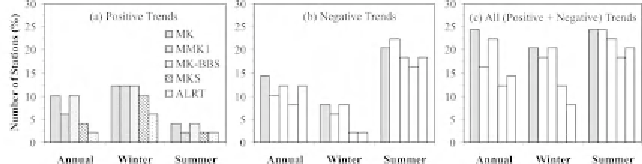
The number of stations where the trends were found significant (at 5%
significance level) with the above five tests is shown in Fig. 10.9. From the
results of Fig. 10.9, the effect of LTP on trend significance is obvious, i.e.,
some of the significant trends noted with the assumption of independence and
STP simply disappeared.
Fig. 10.9.
Number of stations with significant (at 5% significance level) (a)
positive (or upward) and (b) negative (or downward) trends observed in time
series of annual, winter and summer 30-day low flows. Number of all stations
with significant trends is shown in panel (c). The positive and negative type of
trend was decided on the basis of the sign of the MK test statistic.
It is difficult to clearly appreciate the influence of STP and LTP on trend
significance from the results shown in Fig. 10.9, where only one significance
level was used. The effect of these serial structures on trend significance was
explored further using selected tests
p
-values, since it is the
p
-value of the
trend test which is affected by any of these three assumptions. The differences
between the
p
-values obtained with the MK test from those obtained with the
MK-BBS and MKS tests are shown in Fig. 10.10. The results for the STP case
shown in Figs 10.10(a-c) demonstrate that the
p
-values increased for positively
autocorrelated time series and decreased for negatively autocorrelated time
series. This suggests that it is very likely that the MK test with the independence
assumption would produce significant trends more (less) frequently for
positively (negatively) autocorrelated time series. This observation is in
agreement with the results presented in Fig. 10.2 using simulated data. In Fig.
10.10, the higher range of
p
-value differences shown in Figs 10.10(d-e) for
Search WWH ::

Custom Search