Geoscience Reference
In-Depth Information
10.3.2 Seasonality of Low Flows
Low flows in Canadian streams exhibit a seasonal behaviour (Waylen and
Woo, 1987; Sushama et al., 2006; Khaliq et al., 2008) and they occur because
of two different seasonal mechanisms. Firstly, the low flows occur as a result
of storage depletion following below freezing temperatures during the winter
season. Secondly, the low flows occur as a result of lack of precipitation and
increased evaporation due to higher temperatures during the summer season.
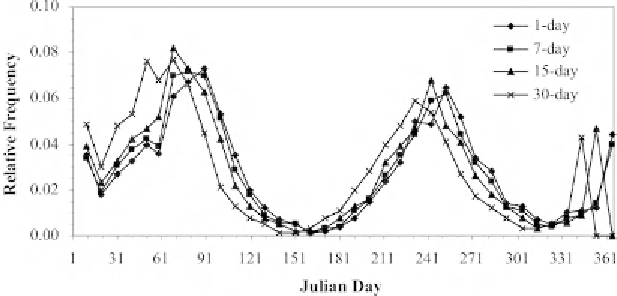
Seasonality of annual 1-, 7-, 15- and 30-day low flows is shown in Fig. 10.6.
This figure suggests that it is important to study the temporal behaviour of low
flows on seasonal scales because the annual scale alone would not be able to
capture the seasonality of low flow regimes of river basins included in the
RHBN. Also, for many of the stations, samples of low flows derived on the
basis of annual time scale may appear physically inconsistent. Based on the
seasonality of annual 7-day low flows, Khaliq et al. (2008) classified the
RHBN stations into three categories: (a) stations with low flows occurring in
winter only, (b) stations with low flows occurring in summer only, and (c)
stations with low flows occurring in both winter and summer seasons (i.e.,
mixed low flows). This seasonal classification of 201 RHBN stations is shown
in Fig. 10.4 and that of the selected 49 RHBN stations, with longer records,
is shown in Fig. 10.5. For this seasonal categorization, six-monthly winter
(December to May) and summer (June to November) seasons were used. For
the selected 49 stations, time series of summer low flows would be the same
as those of annual low flows for four stations and time series of winter low
flows would be the same as those of annual low flows for seven stations and
they would be different from each other for the remaining 38 stations due to
Fig. 10.6.
Relative frequencies of starting dates of occurrences of 1-, 7-, 15- and
30-day annual low flows observed at 201 RHBN stations during 8590 station
years. For developing these frequency plots, each month was divided into three
non-overlapping time windows: first window: 1 to 10 days; second window:
11 to 20 days; and third window: remaining days of the month.
Source:
Khaliq et al. (2008).
Search WWH ::

Custom Search