Geoscience Reference
In-Depth Information
some parts of the country, both annual high and low flows could come from
more than one generating mechanism (Waylen and Woo, 1982, 1987).
Daily streamflows from the Canadian RHBN were used in the case study.
The RHBN, a subset of the national hydrometric network, shown in Fig. 10.4
was identified for use in the detection, monitoring, and assessment of climate
change across the country (Brimley et al., 1999; Harvey et al., 1999). The
RHBN covers most of Canada's major hydrologic regions, although there are
gaps in some regions of the country and there are no RHBN stations north of
70 degrees latitude. The river basins of RHBN are characterized by either
pristine or stable hydrological conditions. Originally, the RHBN consisted of
249 hydrometric stations, including continuous and seasonal streamflow and
continuous lake level stations. According to Khaliq et al. (2008, 2009b), this
network has evolved over the years and it consisted of 229 hydrometric stations
based on the best available information at that point in time. Of these 229
stations, 201 stations have continuous year-round streamflow observations;
the remaining 28 stations are either lake level stations or stations which do not
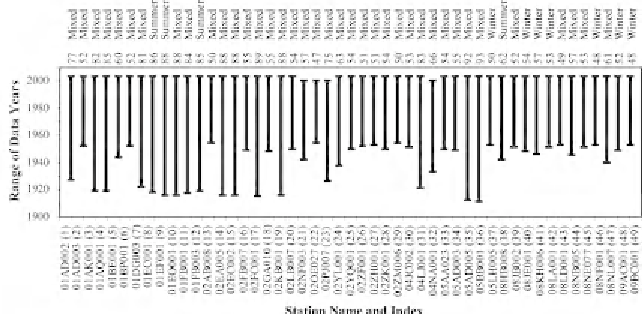
have year-round continuous records. Of the total 201 stations, the stations
with relatively longer records (i.e. 50 years) and with not more than three
missing years were considered for the present study. There are 49 hydrometric
stations that satisfy this criterion; their description is provided in Fig. 10.5.
Continuous daily streamflow data of the selected 49 hydrometric stations
were obtained from the Water Survey of Canada's HYDAT data archive (http:/
/www.wsc.ec.gc.ca/hydat/H20, accessed on 15 January 2008). For most of
these stations (45), data until 2003 were analyzed except for stations located
in the province of Quebec. For four hydrometric stations in the province of
Quebec, data up to the end of 2000 were analyzed.
Fig. 10.5.
List of 49 Canadian RHBN stations with record length
50 years
(allowing three missing years). Number of years of record used in the analysis
and the seasonal (i.e. winter, summer and mixed) classification of low flows for
a given station are shown along the top x-axis. Station names and indices are
shown along the bottom x-axis. Figure modified from Khaliq et al. (2009b).
Search WWH ::

Custom Search