Geoscience Reference
In-Depth Information
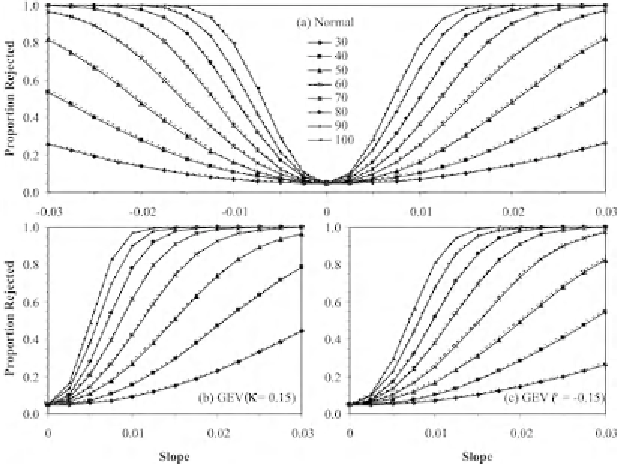
Fig. 10.1.
A Monte Carlo simulation based comparison of the ability of the MK
and SROC tests for identifying trends in samples from (a) Normal and (b-c) GEV
(with shape parameter
N
) distributions. Rejection rates (shown on the y-
axis) correspond to 5% significance level and solid (dotted) lines correspond to
MK (SROC) test. Because of approximate symmetry, only right halves of the
plots corresponding to positive (increasing) trends are shown in Figs 10.1(b, c).
0.15
10.2.2 Type of Trend Model
The widely used MK test identifies only the presence or absence of a trend
through a test of significance and it does not specify whether the trend is
linear or nonlinear. Therefore, in most of the studies on trends, the MK test
was combined with a nonparametric estimator of monotonic trend which is
commonly known as Sen's slope estimation technique (Sen, 1968); details
about the Sen's slope estimation are provided in Chapter 4 of this topic.
Though a monotonic trend represents rather a general case (that could include
a step change at some time point over the period of observations or an
exponential or logarithmic trend, etc.), it was often assumed as linear for
practical applications. In addition to this, a least squares linear regression-type
trend was also estimated in numerous studies. Thus, in most of the studies on
trends, a monotonic or a linear trend was assumed. On the other hand, it is
straightforward to investigate presence of linear as well as any type of nonlinear
trends using parametric approaches that involve modelling of hydrological
variables. For example, both linear as well as nonlinear trends in characteristics
of flood flow series were considered by Strupczewski et al. (2001) for modelling
non-stationary frequency-magnitude relationships for Polish rivers.

Search WWH ::

Custom Search