Geoscience Reference
In-Depth Information
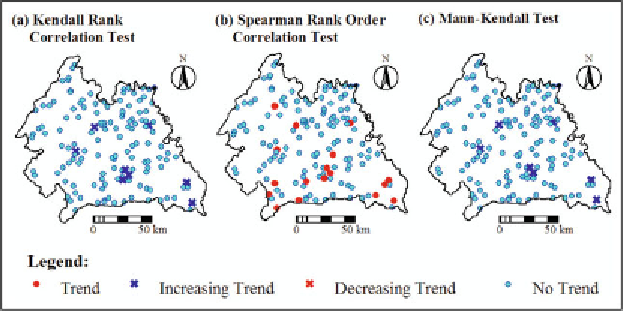
The three clusters of increasing trend sites are not clearly visible in the case
of net recharge due to relatively less number of sites having increasing trend
compared to the pre- and post-monsoon groundwater level time series.
Fig. 8.8.
Trends and no trends in the annual net recharge based
on the three trend tests.
8.6.2 Homogeneity/Non-homogeneity of Annual Net
Recharge
Results of the seven homogeneity tests indicating number of sites with presence/
absence of the homogeneity in the annual net recharge time series are shown
in Fig. 8.9.
Figure 8.9 shows that the number of sites having homogeneity or non-
homogeneity differs for different homogeneity tests. The Hartley test suggests
homogeneity in the annual net recharge at about 98% of the sites, whereas the
von Neumann test indicates homogeneity only at 34% sites. The results of the
Link-Wallace and both the test-statistics (
U
and
A
) of the Bayesian tests show
that annual net recharge time series is homogeneous at 93% sites. In case of
Cumulative Deviations tests, the applied
Q
and
R
test-statistics indicate
homogeneity in 88 and 99% sites, respectively (Fig. 8.9). The Tukey test
reveals that 96% sites have homogeneous annual net recharge time series.
Thus, six of the nine applied test-statistics suggest homogeneity in annual net
recharge at more than 90% sites.
A comparison of the homogeneity results for annual net recharge time
series with those of seasonal groundwater level time series reveals that the
annual net recharge time series is relatively more homogeneous than pre- and
post-monsoon groundwater levels (Figs 8.6 and 8.7). It is worth mentioning
that unlike pre- and post-monsoon groundwater levels non-homogeneous annual
net recharge sites are not very dense and hence, no cluster could be delineated
for the net recharge.
Search WWH ::

Custom Search