Geoscience Reference
In-Depth Information
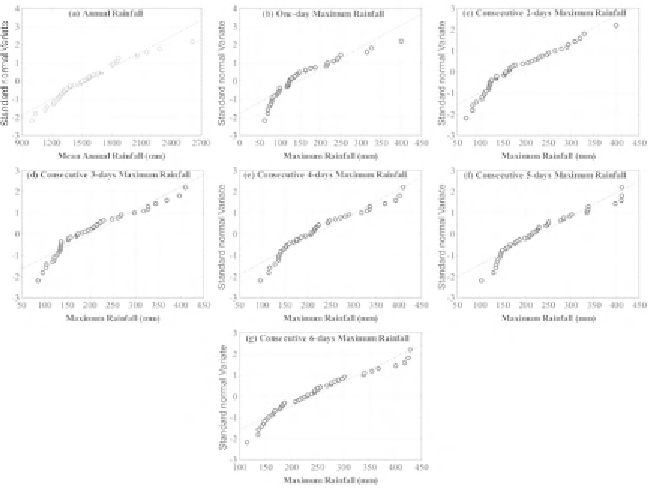
One of the most significant findings of box plot analysis, is the presence
of mild outliers in the total annual rainfall, one-day and consecutive 2-day
maximum rainfall time series. Therefore, normal probability plots [Figs 7.3(a-
g)]
were drawn for testing the significance of mild outliers and normality of
the rainfall data. The normal probability plot is reported to be the single-most
valuable graphical aid in diagnosing how a population distribution appears to
differ from a normal distribution (PROPHET StatGuide, 2007). These plots
revealed that for the one-day and consecutive 2- and 3-day maximum rainfall,
a straight line cannot be obtained on normal probability plots, whereas the
data of the remaining rainfall series do not deviate significantly from the
straight line. The non-normality in one-day and consecutive 2-day maximum
rainfall time series could be attributed to the presence of few mild outliers as
mentioned earlier.
Fig. 7.3.
Normal probability plots of the (a) annual and (b-g) salient
consecutive days' maximum rainfall time series of Kharagpur.
Dotted straight lines represent regression lines.
7.4 Checking Normality
Three most-widely used statistical tests, i.e., Geary's Test (Walpole and Myers,
1989), Kolmogorov-Smirnov test (NIST/SEMATECH, 2007) and D'Agostino-
Pearson Omnibus test (D'Agostino, 1986), were applied to examine the
normality of the rainfall series under study. Results of these normality tests
are presented in Table 7.1. If normality is present in a time series, the Geary's

Search WWH ::

Custom Search