Geoscience Reference
In-Depth Information
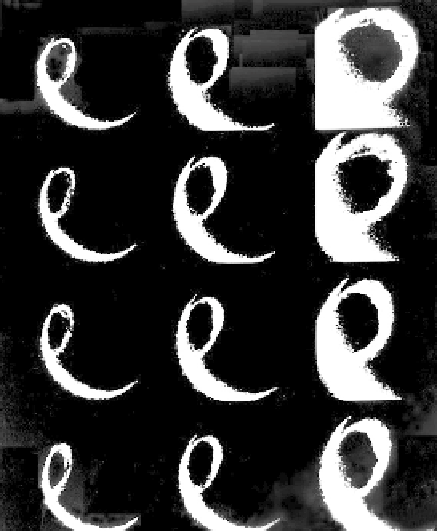
Figure 10.12
Twelve consecutive images at ultraviolet wavelengths 123-160 nm record
the development of an auroral substorm. The sequence begins at 0529 UT on April 2,
1982 (bottom left image), as the NASA/GSFC spacecraft
Dynamics Explorer 1
first views
the auroral oval from the late evening side of the dark hemisphere at low northern lat-
itudes near apogee (3.65 earth radii altitude) and then from progressively greater lati-
tudes as the spacecraft proceeds inbound over the auroral oval toward perigee. In each
panel, time increases upward and from left to right. The poleward bulge at onset of
the auroral substorm is observed beginning at 0605 UT (fourth frame at upper left). In
successive 12-minute images the substorm is observed to expand rapidly in latitude and
longitude. (Figure courtesy of L. A. Frank, J. D. Craven, and R. L. Rairden, University of
Iowa.)
that it is often difficult to separate out cause and effect in that sector. In some
cases the character of the density profile itself gives a clue to the origin or at
least the time history of the plasma. For example, if the E-region density is high,
production must be occurring simultaneously, since recombination is very fast at
low altitudes. Likewise, if electron temperature data are available (for example,
from an incoherent scatter radar), they may be used to determine the history of
F-region plasma. If precipitation is occurring,
T
e
will be well elevated over the ion
and neutral temperatures. If the long-lived F-region plasma has been produced
elsewhere and has been advected into the field of view, however, the electron
temperature will have had time to equilibrate with the other gases and a low
T
e
is expected.
Search WWH ::

Custom Search