Geoscience Reference
In-Depth Information
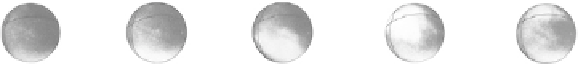
of plasma that are detected and which can be tracked by optical techniques. The
all-sky camera photographs in Fig. 10.1 show just such a plasma patch marching
across the field of view over Thule, Greenland. These structures are of the order
of 1000 km across.
In Section 10.2 we study the plasma instabilities that may develop on the edges
of these regions of enhanced plasma density, but here we are interested in their
origin and lifetime. This is determined by both recombination and diffusion. As
noted by Rishbeth and Garriott (1969) and discussed in Chapter 5, a Chapman-
like F layer subject to diffusion, gravity, and loss will preserve its shape and decay
at a rate given by
e
−
β(
z
0
)
t
, where
β(
z
0
)
is the recombination rate at the altitude
z
0
of the peak in the plasma density. The decay time constant is about 1 hour.
Numerical calculations verify this behavior (Schunk et al., 1976; Schunk and
Sojka, 1987). The typical dawn-dusk electric field across the polar cap with
B
z
south is 25mV/m, which corresponds to 500m/s velocity. In 1 h then a convecting
patch can move 1800 km, just over 16
◦
of latitude. Clearly, in such a rapid flow
pattern both the dayside auroral oval and the sunlit dayside of the high-latitude
zone can supply plasma to the dark polar cap regions with only modest loss due
to recombination, gravity, and parallel diffusion.
Diffusion of plasma perpendicular to
B
is much more complex and interesting
than parallel diffusion, and we discuss this in Section 10.3.2. A quick estimate,
however, shows that large structures will easily survive transport over long dis-
tances without perpendicular diffusive loss. The time scale for perpendicular
diffusion,
τ
D
, is given by
k
2
D
⊥
)
−
1
τ
D
=
(
For the F region the classical diffusion coefficient has an upper limit given
by the ion diffusion coefficient
D
i
⊥
, which has typical values in the range
10-50m
2
/s. Even for
D
i
⊥
=
50m
2
/s, a 10 km wavelength structure has a time
constant of 14 h. The evolution of large-scale features is therefore controlled
Drift of polar cap ionization patch
Thule, 22 January 1982
6300-Å All-sky photometer images
00
06
18
12 CGT
10:06
10:11
10:21
10:36
10:41 UT
Figure 10.1
All-sky (155
◦
field of view) 6300-
Å
images at 5-minute intervals illustrating
large-scale patch structure and drift in the polar cap. The dawn-dusk and noon-midnight
meridians are projected into the images at a height of 250 km. [After Weber et al. (1986).
Reproduced with permission of the American Geophysical Union.]

Search WWH ::

Custom Search