Geoscience Reference
In-Depth Information
00.00
1
00.00
1
0h
1 h 40 m
06.001
1
18.00
06.00
1
118.00
1
12.00
1
12.00
00.00
1
4h
118.00
06.001
(k)
1
12.00
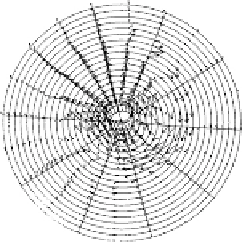
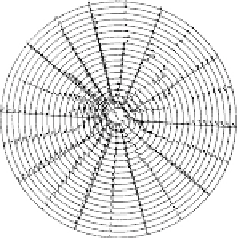
Figure 9.18
Plot of wind vectors from 50
◦
latitude to the pole at 240-km altitude during
a simulated substorm. Plots are shown at intervals of 0, 1 h 40min, and 4 h. Scale: an
arrow the same length as 2
◦
in latitude corresponds to 160m/s. [After Fuller-Rowell and
Rees (1981). Reproduced with permission of Pergamon Press.]
time intervals after a model magnetic substorm that starts at
t
=
0 and lasts
for 2 h. The initial plot at
t
+
20min is representative of the solar forced winds.
By
t
100min a clear vortex has formed in the dusk sector where wind speeds
exceed 300m/s. Very low velocities are found in the morning hours where the
substorm effects are counteracting the solar forcing. Two hours after the storm
ended, the pattern returned virtually to the initial state.
Winds in the E region for the same simulation are shown in Fig. 9.19 at
+
t
100min. Note that the scale differs by a factor of four relative to the
F region calculation. The wind vectors show a clear double-cell pattern with a
line of symmetry running from 0300 to 1500. The symmetry of the two vortices
is due to the lower value of pure solar forcing at E-region heights. The rotation
of the pattern away from a noon-midnight symmetry is due to the importance
of the Hall conductivity in the
J
+
×
B
force.


Search WWH ::

Custom Search