Geoscience Reference
In-Depth Information
800
m/s
800
m/s
800
m/s
Mar 20, 2001 08 13
Mar 20, 2001 08 42
Mar 20, 2001 08 50
800
m/s
800
m/s
800
m/s
Mar 20, 2001 09 06
Mar 20, 2001 09 17
Mar 20, 2001 09 23
800
m/s
800
m/s
800
m/s
Mar 20, 2001 09 27
Mar 20, 2001 09 32
Mar 20, 2001 09 36
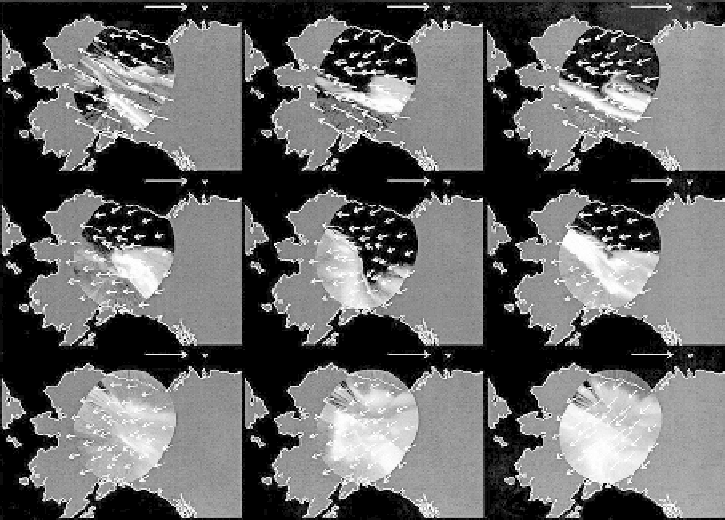
Figure 9.16
All-sky wind observations, along with images of the aurora. (Figure courtesy
of M. Conde.)
Developments in optical technology now permit Doppler shift measurements
of thermospheric winds at up to 48 different locations in an all-sky image. This
“all-sky Fabry-Perot” instrument has shown remarkable variability in the neutral
wind near auroral features. Figure 9.16 shows just such winds via arrows super-
posed on an all-sky image obtained during a magnetic substorm. In the period
of 0813-0906 nT (evening over Alaska), very sizeable thermospherc winds
were blowing parallel to the auroral oval. This is similar to the conditions in
Figs. 9.13-9.15 and likely represents ion drag in a region of sunward plasma
convection. But as the substorm developed, the wind rotated toward the south-
west. This change most likely was due to a combination of change in the pressure
gradients due to Joule heating and ion drag due to antisunward convection closer
to magnetic midnight. We simply do not understand neutral/plasma interactions
on our own planet.
9.3.2 Global Observations and Simulations
Heppner andMiller (1982) collected a number of barium neutral cloud measure-
ments in the thermosphere and compared them to several convection models.
One such comparison is shown in Fig. 9.17. The wind vectors are superimposed
on a representative convection pattern in Fig. 9.17a at the observed location in

Search WWH ::

Custom Search