Geoscience Reference
In-Depth Information
AE-C RPA drift meter
Orbit 5840
5 Mar 75
253
253
254
254
252
251
249
ALT
1400
Vertical
700
0
2
700
Horizontal
2
1400
14.7
15.3
16.4
18.3
20.6
22.1
23.0
MLT
INV LAT
59.0
66.5
[N
i
]
73.1
76.9
75.5
70.1
63.0
10
6
10
5
10
4
[NO
1
]
10
3
2:52
2:54
2:56
2:58
3:00
3:02
3:04
UT
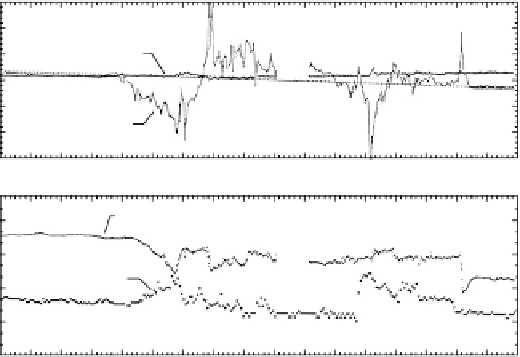
Figure 9.12
The upper panel shows the vertical and horizontal convection velocities
measured by the AE-C satellite. The lower panel shows the total ion concentration com-
prising O
+
and the molecular ions, as well as the NO
+
concentration itself. Notice that
when the horizontal ion drift is large, the relative abundance of NO
+
increases due to
the enhancement of the rate of reaction (9.13a). (Figure courtesy of R. Heelis and W.
Hanson.)
at least an order of magnitude over NO
+
for almost the entire pass. In regions
of large drift, however, we observe an increase in the relative concentration of
NO
+
and a decrease in the total ion concentration. The decrease in total ion
concentration is due to the very rapid recombination of NO
+
.
9.2.4 Positive and Negative Ionospheric Storms
Energy, momentum, and Joule heating in the high latitude ionosphere all con-
tribute to what are known as ionospheric storms. As the names indicate,
ionospheric plasma densities at midlatitudes may be higher or lower than the
norm in various phases of the magnetic storms, which are the primary context
in which ionospheric storms are described. The term ionospheric storm refers
to global ionospheric effects as opposed to Convective Equatorial Ionospheric
Storms (CEIS), described in Chapter 4, and that are confined to the low latitude
sector.
Positive storms can be due to a variety of mechanisms (Fuller-Rowell and
Rees, 1981; Huang et al., 2005). Strong neutral winds blowing equatorward
out of the high latitude zone will tend to push plasma away from the earth
Search WWH ::

Custom Search