Geoscience Reference
In-Depth Information
2
2
Ionosphere
J
J
2
2
2
2
2
1
1
1
2
1
E
1
1
E
E
1
1
2
2
2
2
2
2
2
2
2
2
2
Sprite
2
1
2
2
2
2
2
2
1
1
2
2
2
2
1
1
2
2
2
2
2
2
1
1
2
2
1
1
1
1
1
2
2
2
2
1
2
2
2
2
2
2
2
2
2
2
2
2
2
2
2
2
2
2
2
2
2
2
2
2
2
2
2
2
2
2
2
2
2
2
2
1
1
1
1
1
1
1
1
11 1
1
1
1
11
1
1
Cloud
2
1
CG
2
2
2
2
2
2
2
2
2
2
2
2
Ground
Before 1
CG
~1
2
10 ms after
1
CG
~1sec after
1
CG
Figure 7.19
Schematic diagram of charge configurations in sprite-producing thunder-
cloud (Pasko et al., 1997). (Figure courtesy of V. Pasko and E. Gerken.)
kR
90
687
1km
298
70
178
50
91
30
45
194:06:00:00.150
194:06:00:00.161
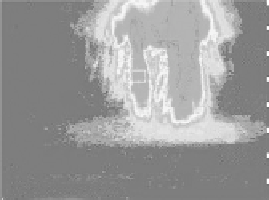
Figure 7.20
Telescopic imaging of sprites. Wide (L) and narrow (R) field-of-view images
of a bright event. [After Gerken et al. (2001). Reproducedwith permission of the American
Geophysical Union.] See Color Plate 26.
based on the work of Pasko et al. (1997). Initially the thundercloud is effectively
a vertical dipole with positive charge on top and negative charge on the bottom.
The ions and electrons in the overlying mesosphere and lower ionosphere are
distributed so as to cancel the electric field created by the thundercloud dipole.
When a
CG occurs and positive charge is removed from the cloud, a subsequent
breakdown, or sprite, can occur above the thundercloud. Following the sprite,
the electrons and ions rearrange to once again reduce the electric field existing
above the cloud. Observations using telescopic imagery have shown that the
lower portions of sprites consist of filamentary structures that are thought to be
streamer discharges (Fig. 7.20; Gerken et al., 2000).
Most of the energy from the lightning EMP is absorbed at the lower boundary
of the ionosphere (D region), but some leaks into the ionosphere as a whistler
+


Search WWH ::

Custom Search